1.Clinical Data Anomaly Heatmap
heatmap · 2026
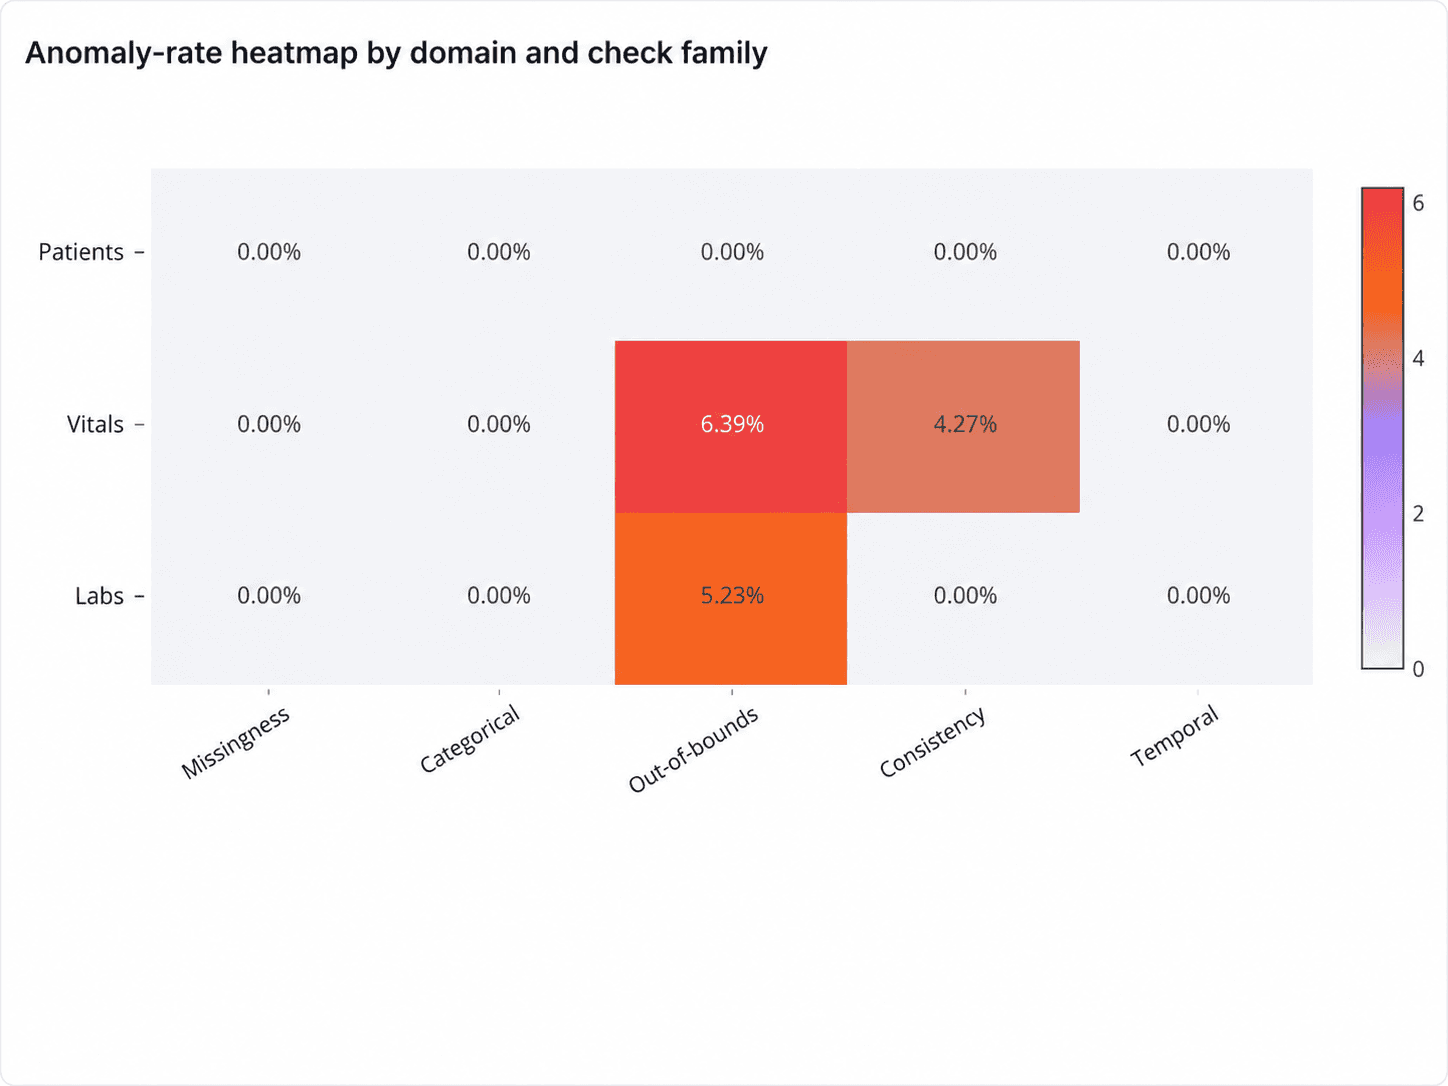
A clinical data analyst used an automated three-table patient data audit to evaluate data quality across Patients, Vitals, and Labs domains. The resulting heatmap visualizes anomaly percentages across five check families: Missingness, Categorical, Out-of-bounds, Consistency, and Temporal. While the Patients domain showed a 0.00% anomaly rate, the Vitals domain revealed a 6.39% out-of-bounds rate and a 4.27% consistency error rate. Labs showed a 5.23% out-of-bounds rate. This visual artifact solved the problem of manually reconciling findings, allowing the analyst to present consolidated cross-table anomalies directly to clinical operations and compliance officers without digging through raw Python terminal outputs.
What it shows:
Consolidating cross-table audit results into a single heatmap accelerates compliance reporting.