1.Comparative Financial Scorecard for Tech Stocks
Investment Analyst · 2026
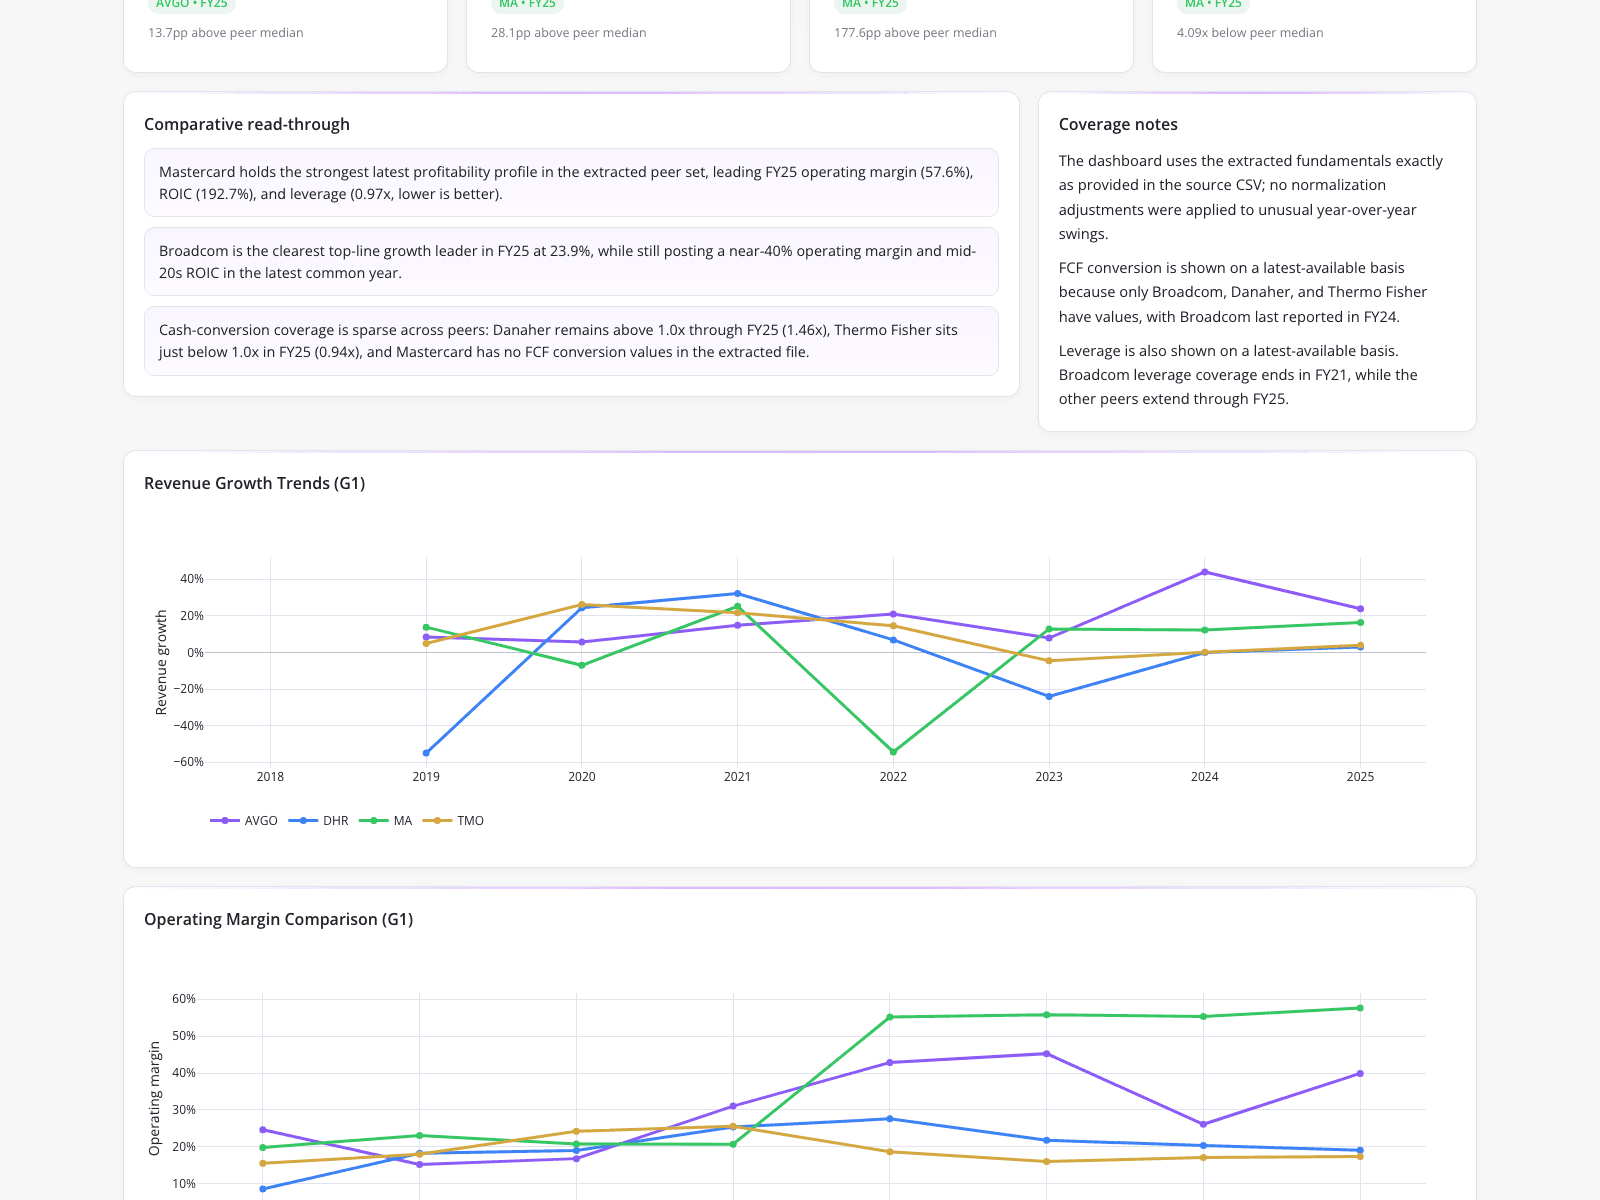
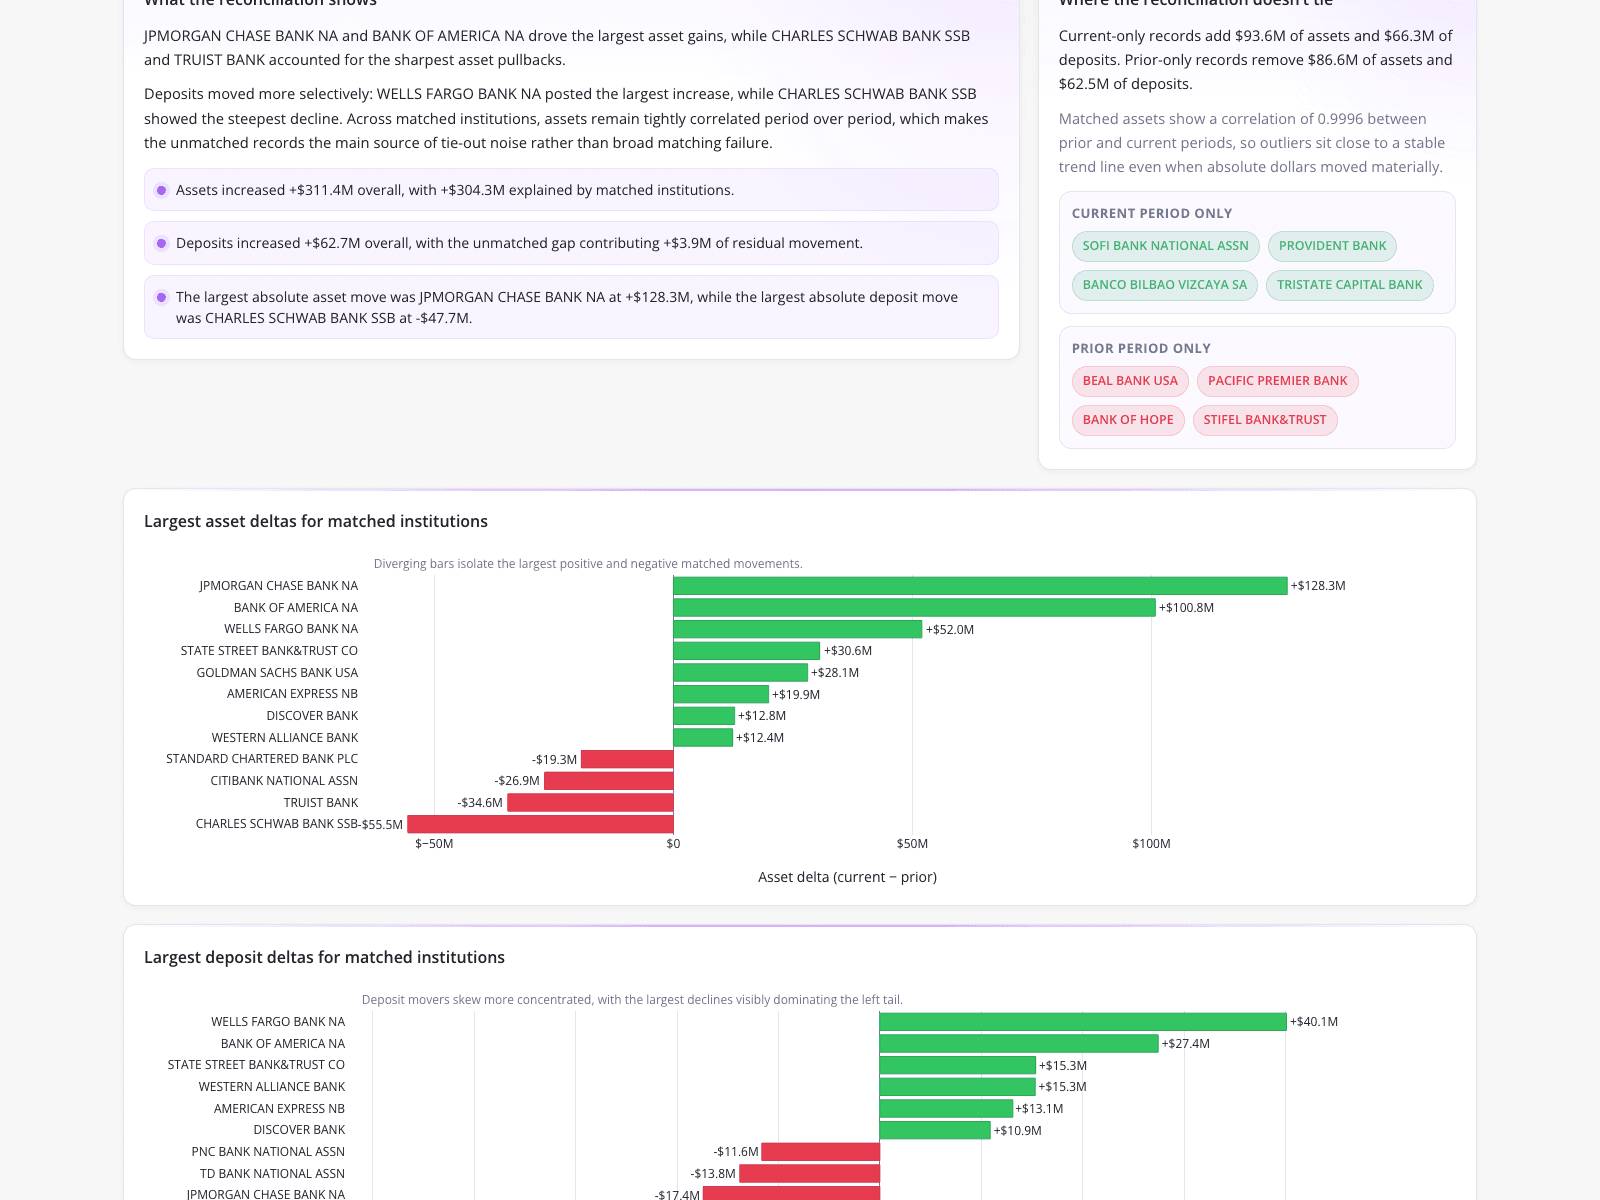
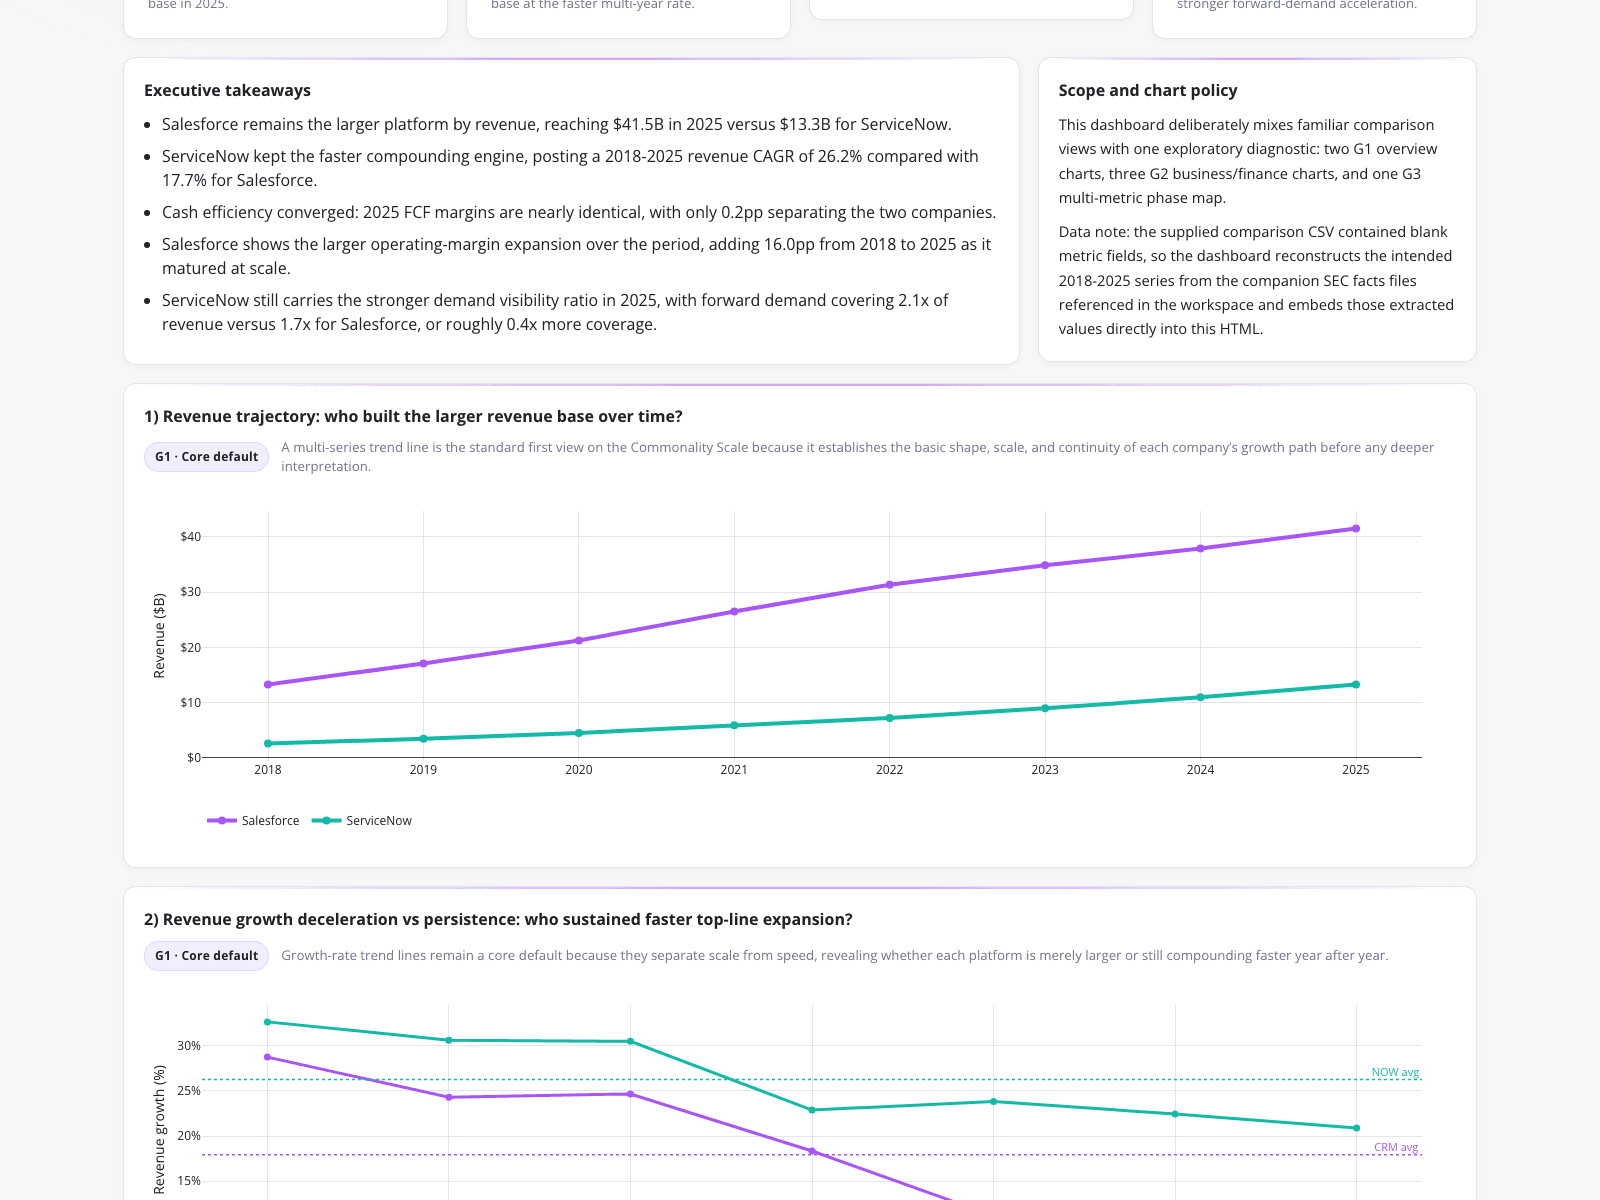
An investment analyst built this comparative financial scorecard dashboard to evaluate Salesforce and ServiceNow against ongoing AI-disruption narratives. To solve the complex challenge of reconciling raw, unstructured SEC filings with mismatched fiscal calendars, the analyst extracted and structured a multi-year metric series. The dashboard features four KPI cards highlighting 2025 performance, including Salesforce's revenue scale lead at $41.5B and ServiceNow's forward demand growth of +26.5%, while an executive takeaways panel summarizes Salesforce's 16.0pp operating margin expansion and a scope panel explains the data reconstruction.
What it shows:
Extracting multi-year metrics enables accurate comparative analysis across mismatched fiscal calendars.