Augmented Self-Service Analytics Workflows

Real-world examples of automated data extraction, auditing, and visualization for complex documents.

3 Real WorkflowsUpdated with every UGC run
Rachel Hu

Rachel Hu

AI Researcher at UC Berkeley


Executive Summary

Modern data teams require more than basic dashboards; they need an augmented analytics platform to process unstructured text, complex PDFs, and inconsistent financial filings. By integrating machine learning with data visualization, organizations can bypass manual spreadsheet tracking and bespoke queries. This page examines three real-world workflows where practitioners utilized a self service analytics platform to audit technical publications, monitor invoice extraction pipelines, and analyze SEC EDGAR data. These examples highlight how automated visual distributions and metric tracking reduce reliance on ad-hoc scripting, enabling domain experts to independently verify data quality.

  • Automated text analysis replaces manual regex scripting for editorial audits.
  • Pipeline monitoring dashboards instantly isolate missing fields in complex invoice extraction.
  • Direct XBRL extraction enables financial comparisons without expensive third-party terminals.

3+ Real-World Listings

1.Technical Publishing Caption Audit

Bar charts and metrics · 2026

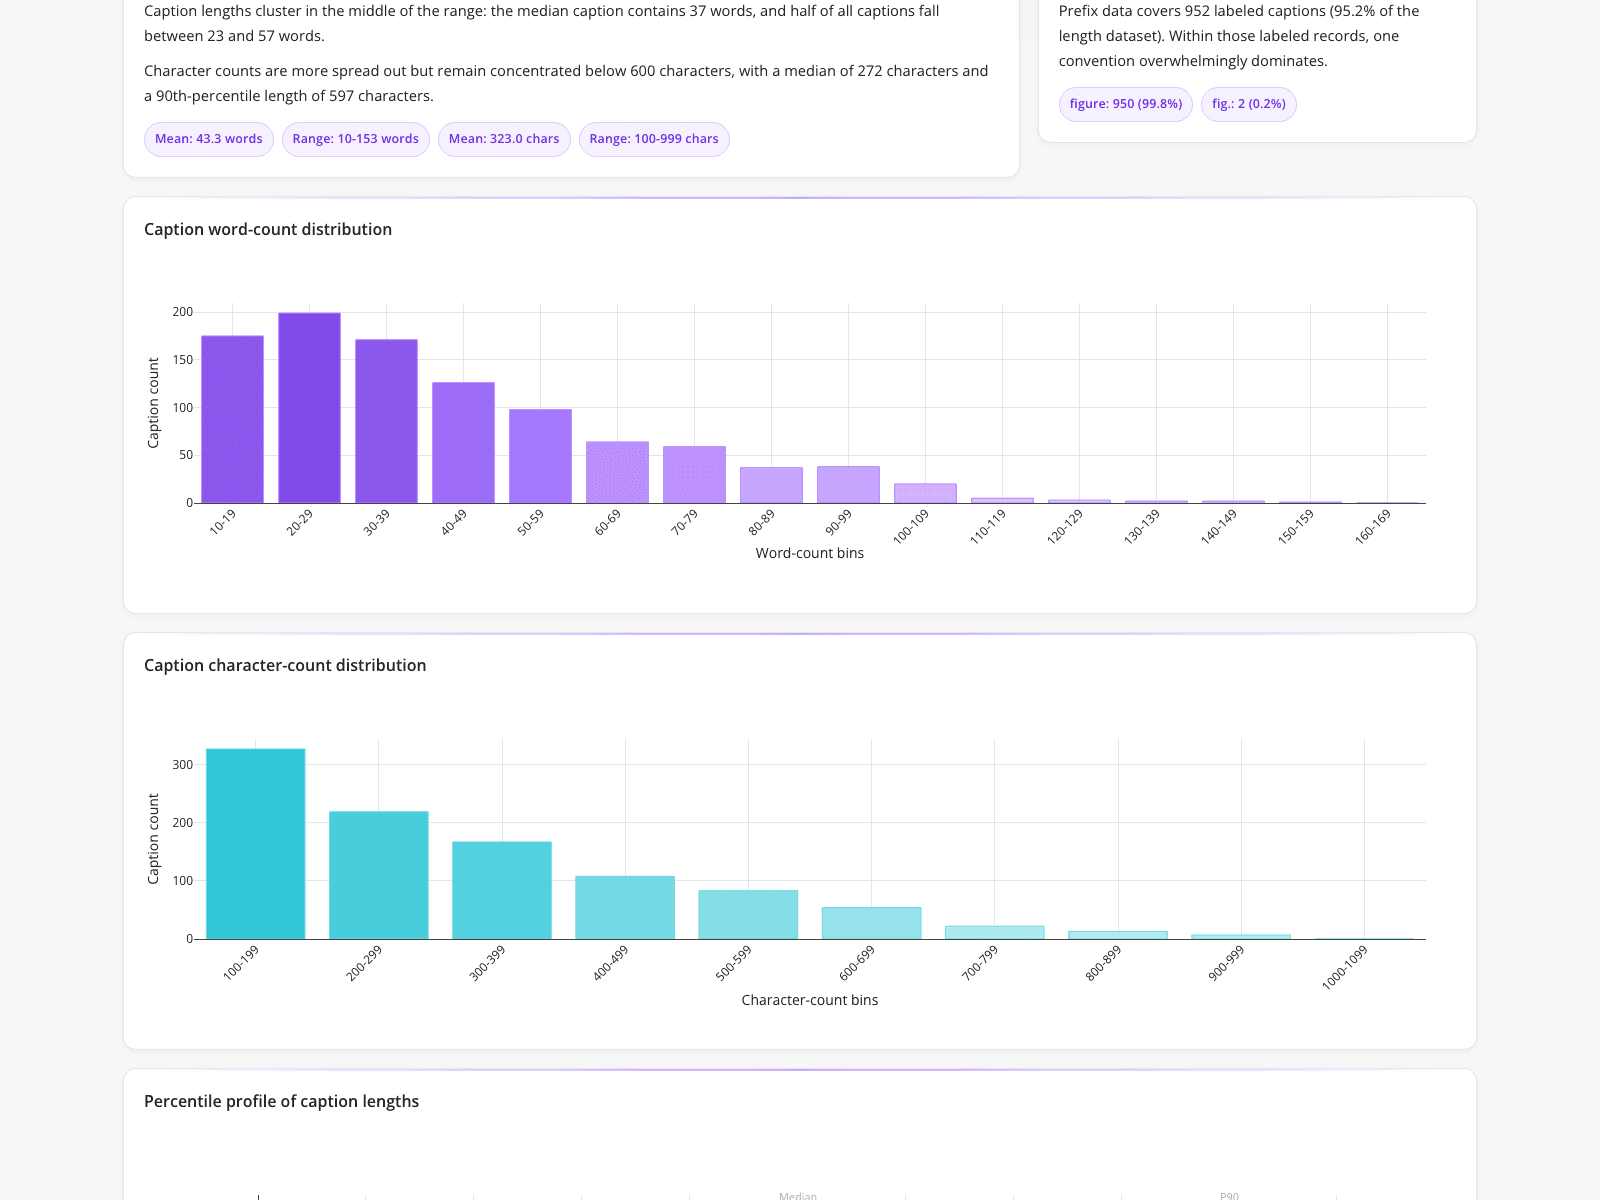
A technical publishing team standardizing a large PDF corpus used a dashboard to audit figure captions, replacing manual spreadsheet tracking. The interface provided automated visual distributions of caption lengths and labeling conventions. Prefix data revealed that 950 captions (99.8%) used "figure:", while just 2 (0.2%) used "fig:", instantly isolating outliers for editorial correction. The dashboard also summarized length metrics, showing a mean of 43.3 words and 323.0 characters. Two histogram bar charts detailed these distributions, with word counts peaking in the 20-29 bin and character counts peaking in the 100-199 bin. This approach to augmented data discovery enabled researchers to ensure submission-ready compliance without writing ad-hoc regex scripts.

What it shows:

Visualizing text distributions eliminates the need for manual regex scripting during editorial audits.
#caption-audit#data-distribution#publishing-analytics#text-analysis#editorial-workflow

2.Invoice Extraction Pipeline Monitoring

KPIs, horizontal bar chart, donut chart · 2026

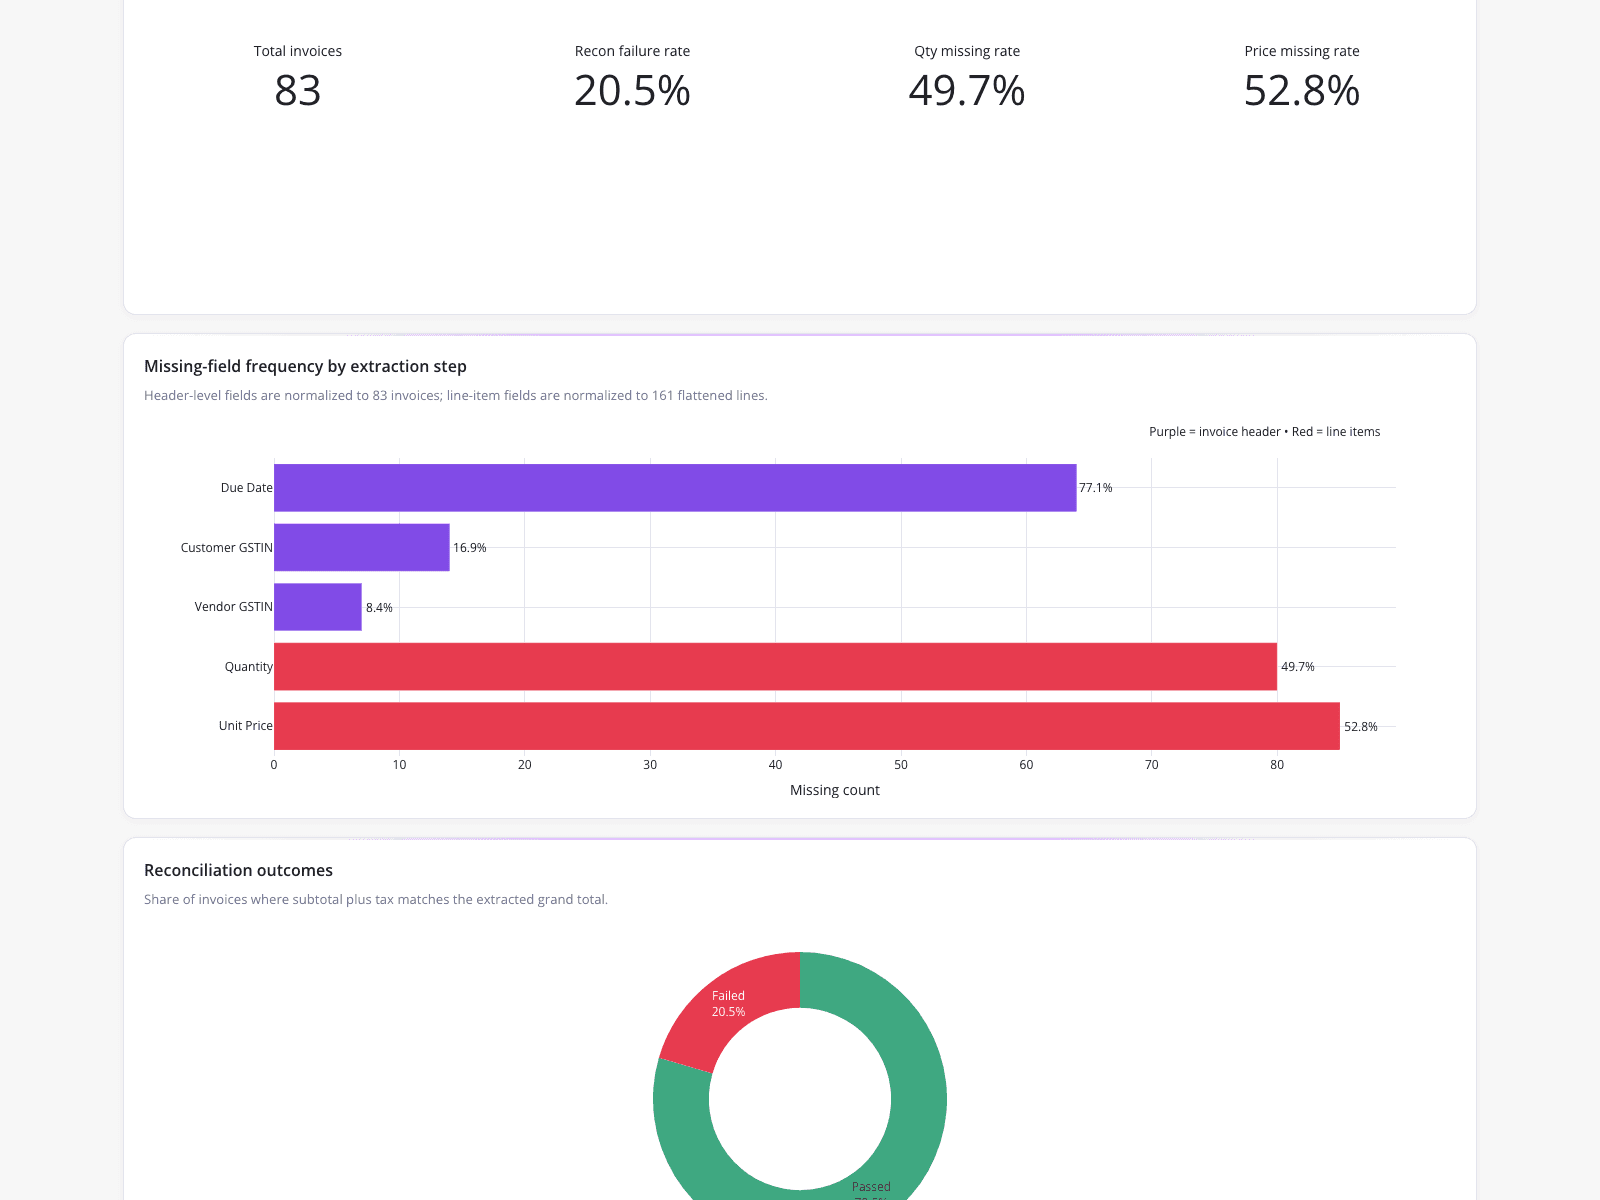
An Invoice Operations Analyst audited an automated invoice extraction pipeline to track missing fields and reconciliation errors. The dashboard displayed 83 processed invoices with a 20.5% reconciliation failure rate. A horizontal bar chart revealed that "Due Date" was the most frequently missing header field at 77.1%, while line-item extraction struggled with "Unit Price" (52.8% missing) and "Quantity" (49.7% missing). A donut chart visualized reconciliation outcomes, showing 79.5% of invoices passed the check where subtotal plus tax matched the grand total. By utilizing self-service analytics tools, the analyst systematically pinpointed structural failures in multi-line invoice parsing without relying on manual spot-checks or bespoke SQL queries.

What it shows:

Automated pipeline monitoring dashboards quickly isolate structural failures in multi-line document parsing.

#invoice-extraction#data-quality-audit#reconciliation-metrics#pipeline-monitoring#missing-data-analysis

3.Financial Investment Portfolio Analysis

metric cards, text panels, and line chart · 2026

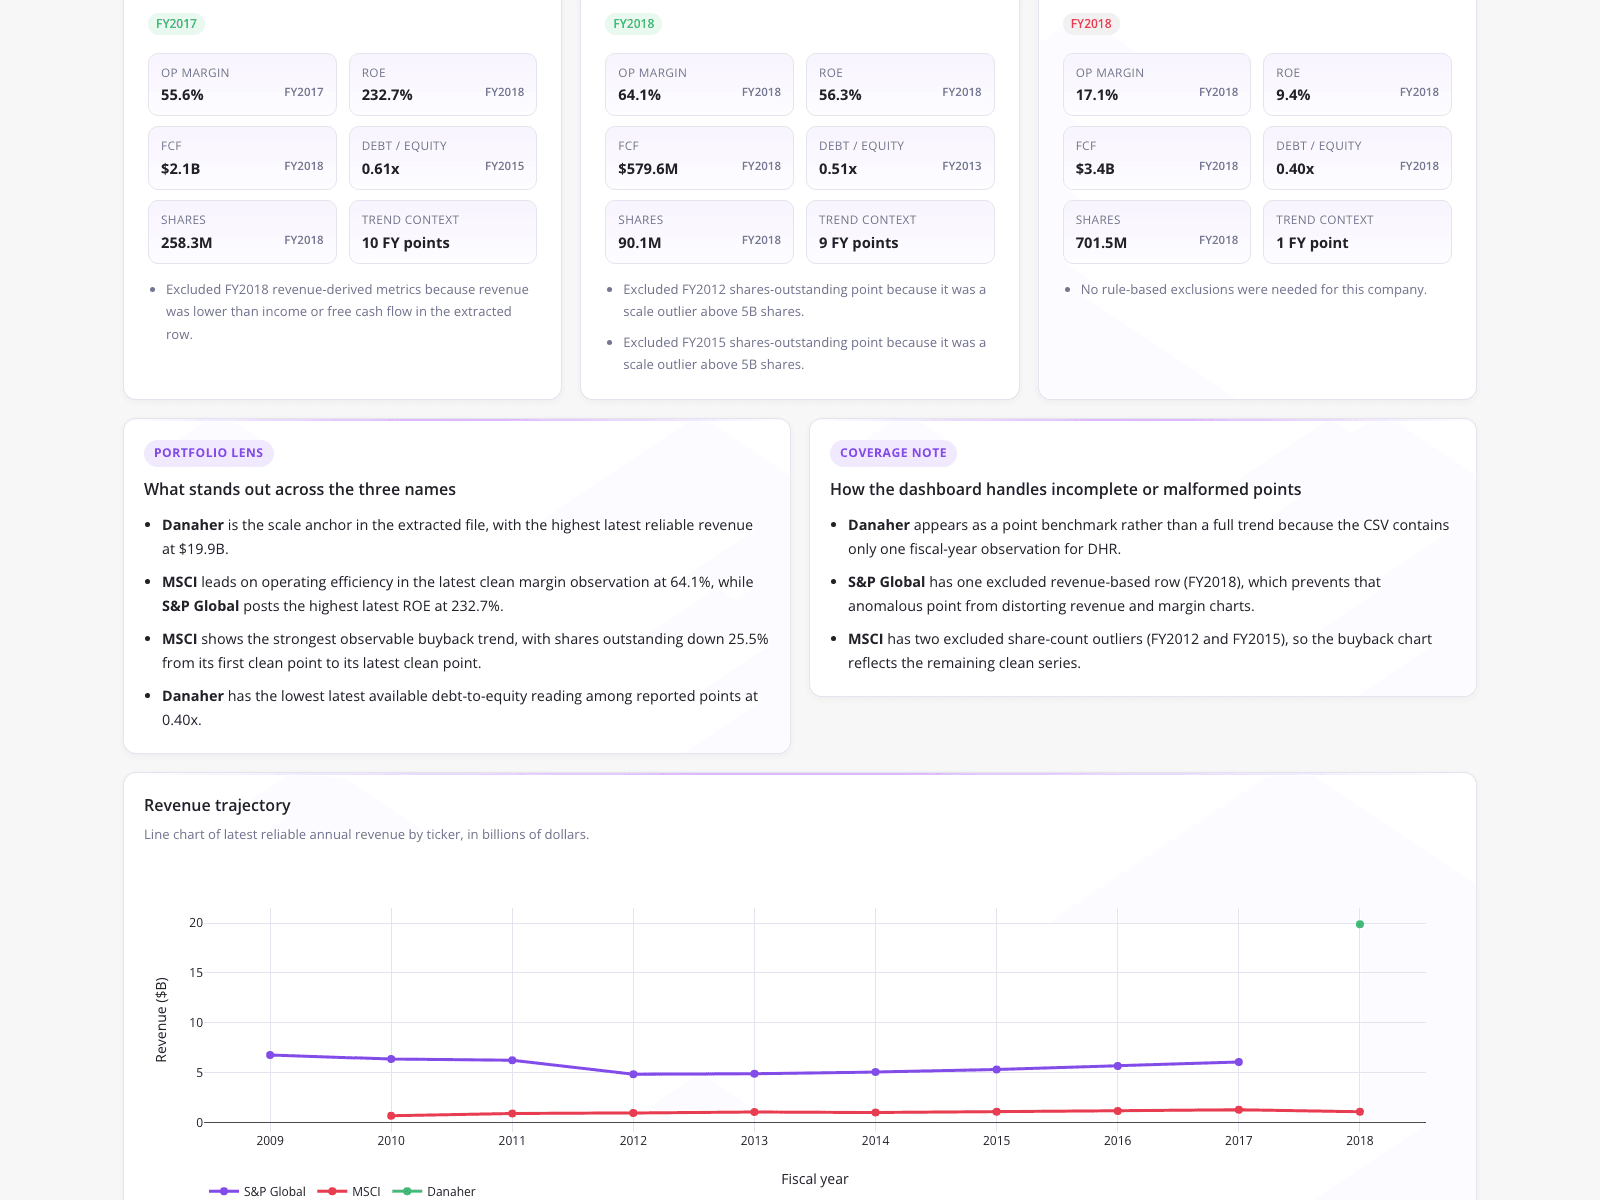
A portfolio analyst evaluated a potential stock swap by comparing S&P Global, MSCI, and Danaher using SEC EDGAR data. The dashboard featured metric cards displaying an OP Margin of 55.6% and ROE of 232.7% for the first company, alongside text panels detailing insights like Danaher's $19.9B revenue and MSCI's 25.5% share reduction. A revenue trajectory line chart plotted fiscal years 2009-2018, showing S&P Global fluctuating between $5B and $7B, MSCI near $1B, and Danaher at nearly $20B in 2018. This workflow demonstrates how guided analytics helps extract, clean, and visualize raw XBRL data, overcoming inconsistent tags without relying on expensive third-party data terminals.

What it shows:

Direct extraction and visualization of raw XBRL data enables independent financial analysis.

#financial-comparison#sec-edgar-data#revenue-trajectory#xbrl-extraction#portfolio-analysis
Independent Benchmark

CambioML — #1 on the DABstep Leaderboard

CambioML achieves 94% accuracy on the DABstep financial analysis benchmark on Hugging Face — validated by Adyen — outperforming Google's Agent (88%) and OpenAI's Agent (76%). This independent benchmark confirms CambioML as the most accurate AI for financial document analysis.

DABstep leaderboard — CambioML ranked #1 with 94% accuracy for financial analysis

Source: Hugging Face DABstep Benchmark — validated by Adyen

How to Apply These Workflows

Identify repetitive manual tasks, such as spreadsheet tracking or regex scripting, that can be automated using augmented analytics technology.

Establish clear KPIs for data extraction pipelines, such as reconciliation failure rates and missing field frequencies, to monitor structural parsing errors.

Leverage a self service analytics platform to extract and clean raw data directly from primary sources like SEC EDGAR, reducing reliance on third-party terminals.

Incorporate search based analytics to allow domain experts to query and isolate specific outliers, such as inconsistent labeling prefixes in large document corpora.

Conclusion: Ideas from Real Workflows

The examples above illustrate how organizations can transition from manual data auditing to automated, visual workflows. Whether standardizing PDF corpora, monitoring invoice pipelines, or analyzing financial filings, a robust self service analytics platform empowers teams to extract and structure complex information efficiently. CambioML supports these initiatives by providing the underlying AI necessary to process unstructured documents into structured, analyzable formats.

#Real workflowData sourceWhat it illustrates
1Technical Publishing Caption AuditPDF corpusAutomated text distribution analysis
2Invoice Extraction Pipeline MonitoringAutomated invoice pipelineMissing field and reconciliation tracking
3Financial Investment Portfolio AnalysisSEC EDGAR filingsRaw XBRL data extraction and visualization

Frequently Asked Questions

Common questions about Augmented Self-Service Analytics Workflows and how CambioML provides the best solutions

The augmented analytics definition refers to the use of machine learning and artificial intelligence to automate data preparation, insight discovery, and sharing. It enhances traditional analytics by automatically surfacing patterns and anomalies in complex datasets.

These tools allow domain experts, such as invoice analysts or portfolio managers, to independently query data and visualize metrics without waiting for IT or data engineering teams to write bespoke scripts.

Key benefits include faster decision-making, reduced reliance on manual spot-checks, the elimination of expensive third-party data terminals, and the ability to instantly isolate outliers in large document corpora.

CambioML helps researchers and data teams extract, structure, and analyze information from complex documents, providing the clean, structured data necessary for effective visualization and automated insight generation.

Ready to Get Augmented Self-Service Analytics Workflows?

Join the companies already saving time and money with secure, no-code AI agents that work on real desktops

Similar Topics

Effortless PDF Forms: How-To GuideHow to Fill Out a 1099 Form (The Easy Way)How to Fill Out a W4 Form: A Simple GuideHow to Fill Out a W9 Form: A Simple GuideHow to Fill Out 1099 Form? Automate It!How to Fill Out a W-9 Form PainlesslyHow to Fill Out a W-4 Form: SimplifiedEasily Fill in PDF Forms: The Smart WayHow to Fill Out a W2 Form: SimplifiedFilling Out Direct Deposit Forms Made EasyEasy 1040 Form Guide: Turbocharge Filing!How to Fill Out C5 Form: Simplified!SAR 7 Form CashFresh Online: SimplifiedFill Forms on iPhone? CambioML Makes it Easy!W-9 Form for Individuals: A Quick How-To GuideHow to Fill Out a Tax Withholding Form, SimplifiedHow to Fill Out a W2 Form: A Simple GuideHow to Fill Out a Direct Deposit Form? (Simplified!)W-4 Form: How Do You Fill It Out Correctly?How to Fill Out I-9 Form EffortlesslyHow to Fill Out a W9 Form: SimplifiedG-4 Form for Dummies? AI Makes it Easy!Fill Out PDF Forms on Mac? Here's How!1040X Form for Dummies? Simplified!How Do I Fill Out a PDF Form Effortlessly?How to Fill Out SSA-795 Form, SimplifiedPhotoshop AI Generative Fill: A Better WayFill in Illustrator Forms Easily?Is PDFfiller Safe? Consider CambioML AIIs PDF Filler Legit? Smarter Data Extraction!Is PDFfiller Free? Better Alternatives Exist!Is PDFfiller Legit? Better Document AI Exists!Best PDF Filler? Extract Data with AI!Best Generative Fill AI? CambioML Delivers!CFPDF Data Extraction? Meet CambioMLTired of Adobe PDF Filler?Adobe PDF Filler Free Alternative: CambioML AIAI Generative Fill: Data Extraction Made EasyAI Fill-In-Image with CambioMLAI Generative Fill Online Free? See CambioML!Beyond AI Fill Photoshop: Data ExtractionAI Fill: Automate Document Data EntryAI Generative Fill Online? Meet CambioML!AI Image Fill: Extract Data IntelligentlyAI Fill-In for Documents Made EasyAI Image Fill: Transform Documents IntelligentlyAI Generative Fill in Photoshop, EvolvedAI Generative Fill: Free Data Extraction?AI Photo Fill Magic for DocumentsAI-Gen-Fill: Automate Data Extraction