1.Curriculum Audit Answer Length Distribution
Educational Researcher · 2026
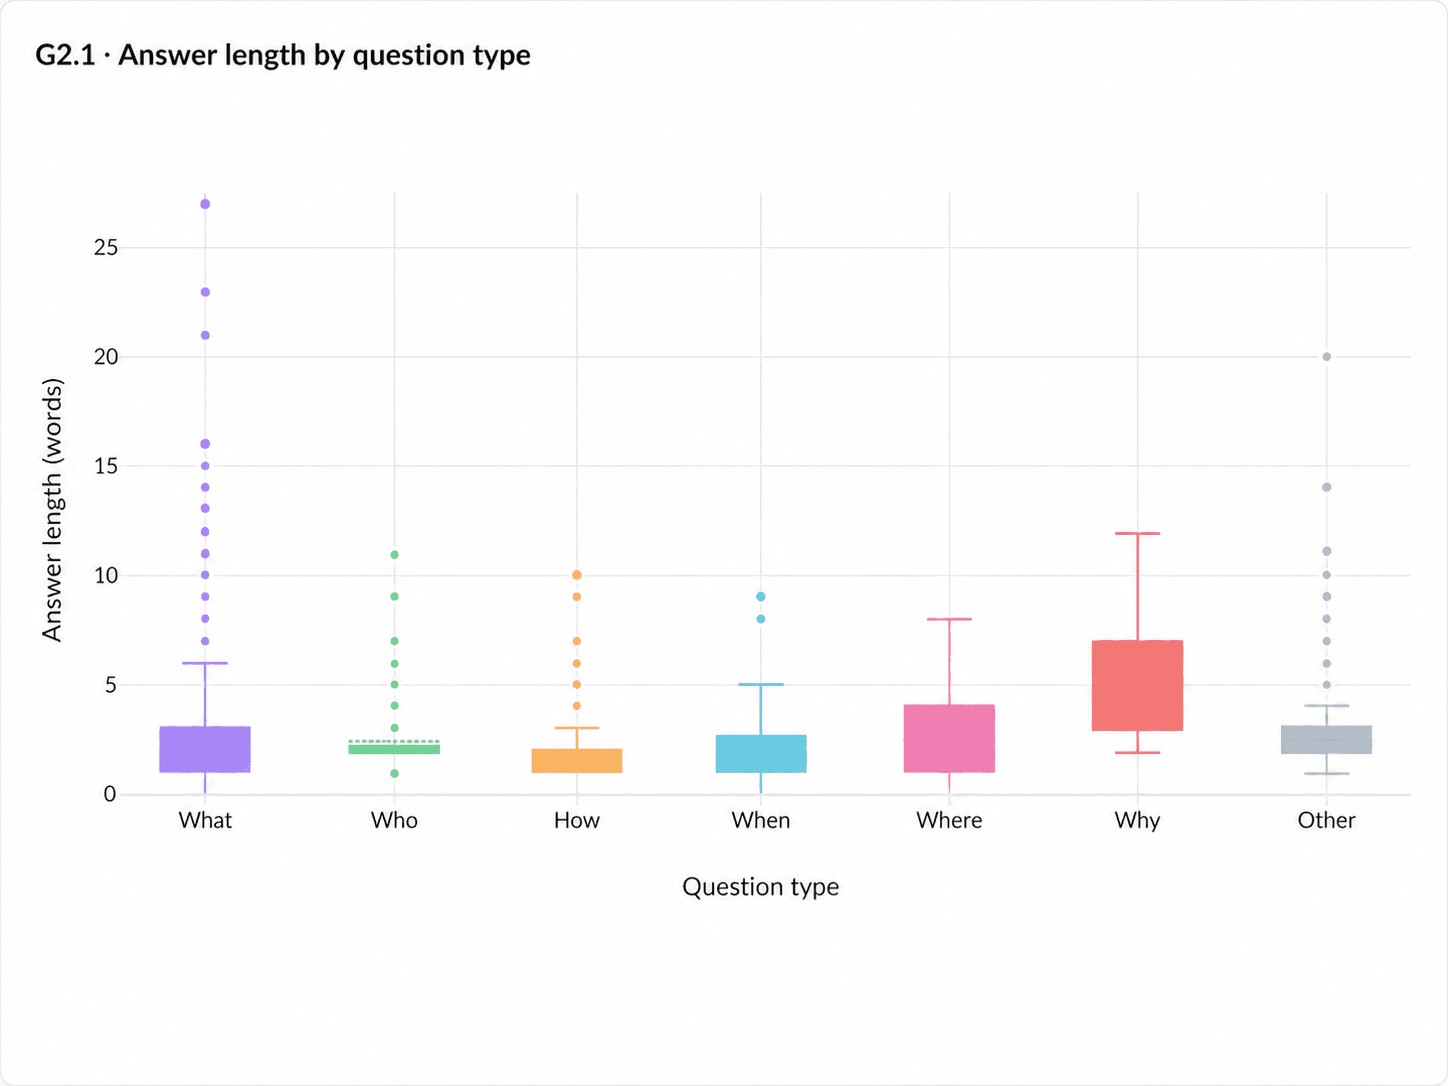
A lead educational researcher utilized this boxplot maker to visualize the distribution of answer lengths across different interrogative categories in a reading-comprehension dataset. The resulting chart reveals severe answer-length compression, showing that "What," "Who," "How," and "When" questions have medians of roughly one to three words, while "Why" questions demonstrate the highest median answer length of around five words. By instantly mapping answer complexity against question types, this box and whisker plot generator replaces hours of manual spreadsheet formatting and COUNTIF formulas previously required to audit dataset quality.
What it shows:
Automating distribution analysis ensures curriculum materials meet cognitive diversity standards before production.