1.Manufacturing equipment failure analysis
Reliability engineering analysis · 2026
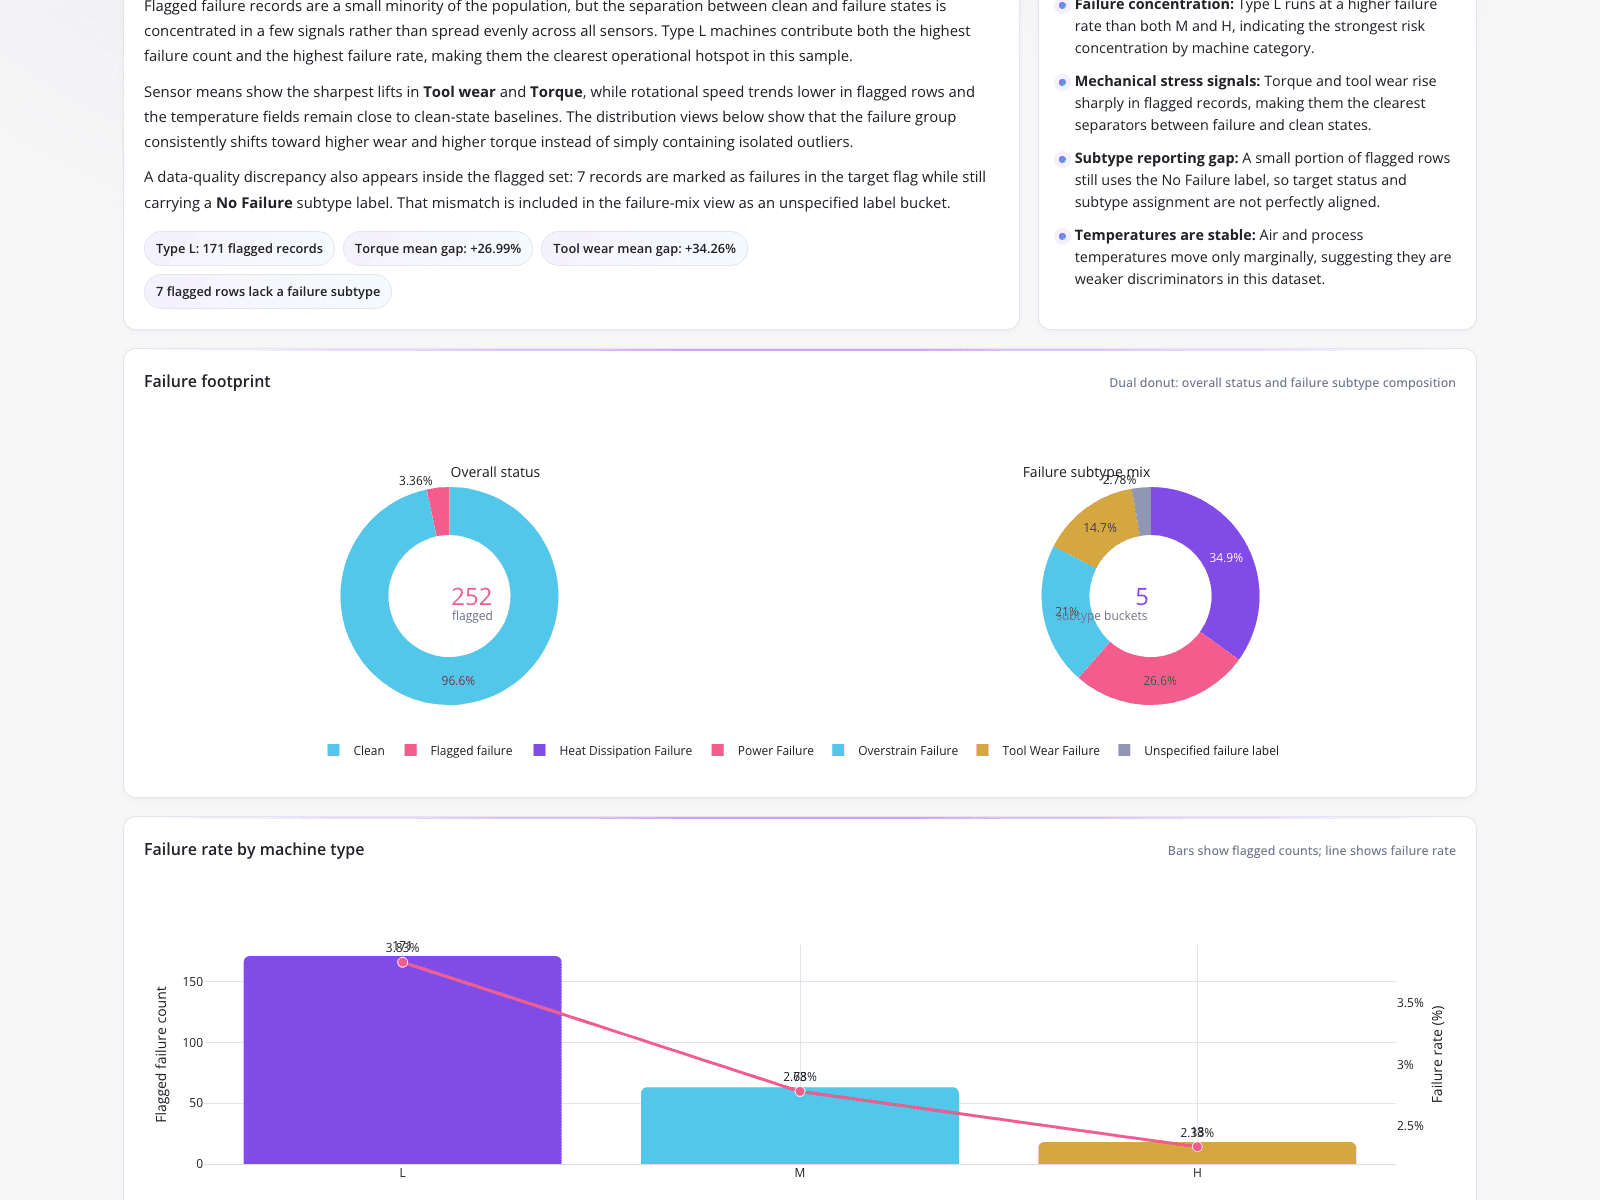
This dashboard enables a manufacturing reliability engineer to replace manual pivot tables by generating narrative summaries and visualizations from the same dataset simultaneously. The top text panel explicitly calls out key sensor deviations, noting a +26.99% mean gap in torque and a +34.26% mean gap in tool wear, while flagging seven records that lack a failure subtype. Below this narrative, a combination of donut and combo charts breaks down the failure footprint, revealing that Heat Dissipation causes 34.9% of failures and that Type L machines carry the highest burden with 171 flagged records.
What it shows:
Directly answers safety review requirements without manual spreadsheet manipulation.
#manufacturing#sensor-monitoring#failure-analysis