1.Real Estate Comparative Market Analysis
Real Estate Analyst · 2026
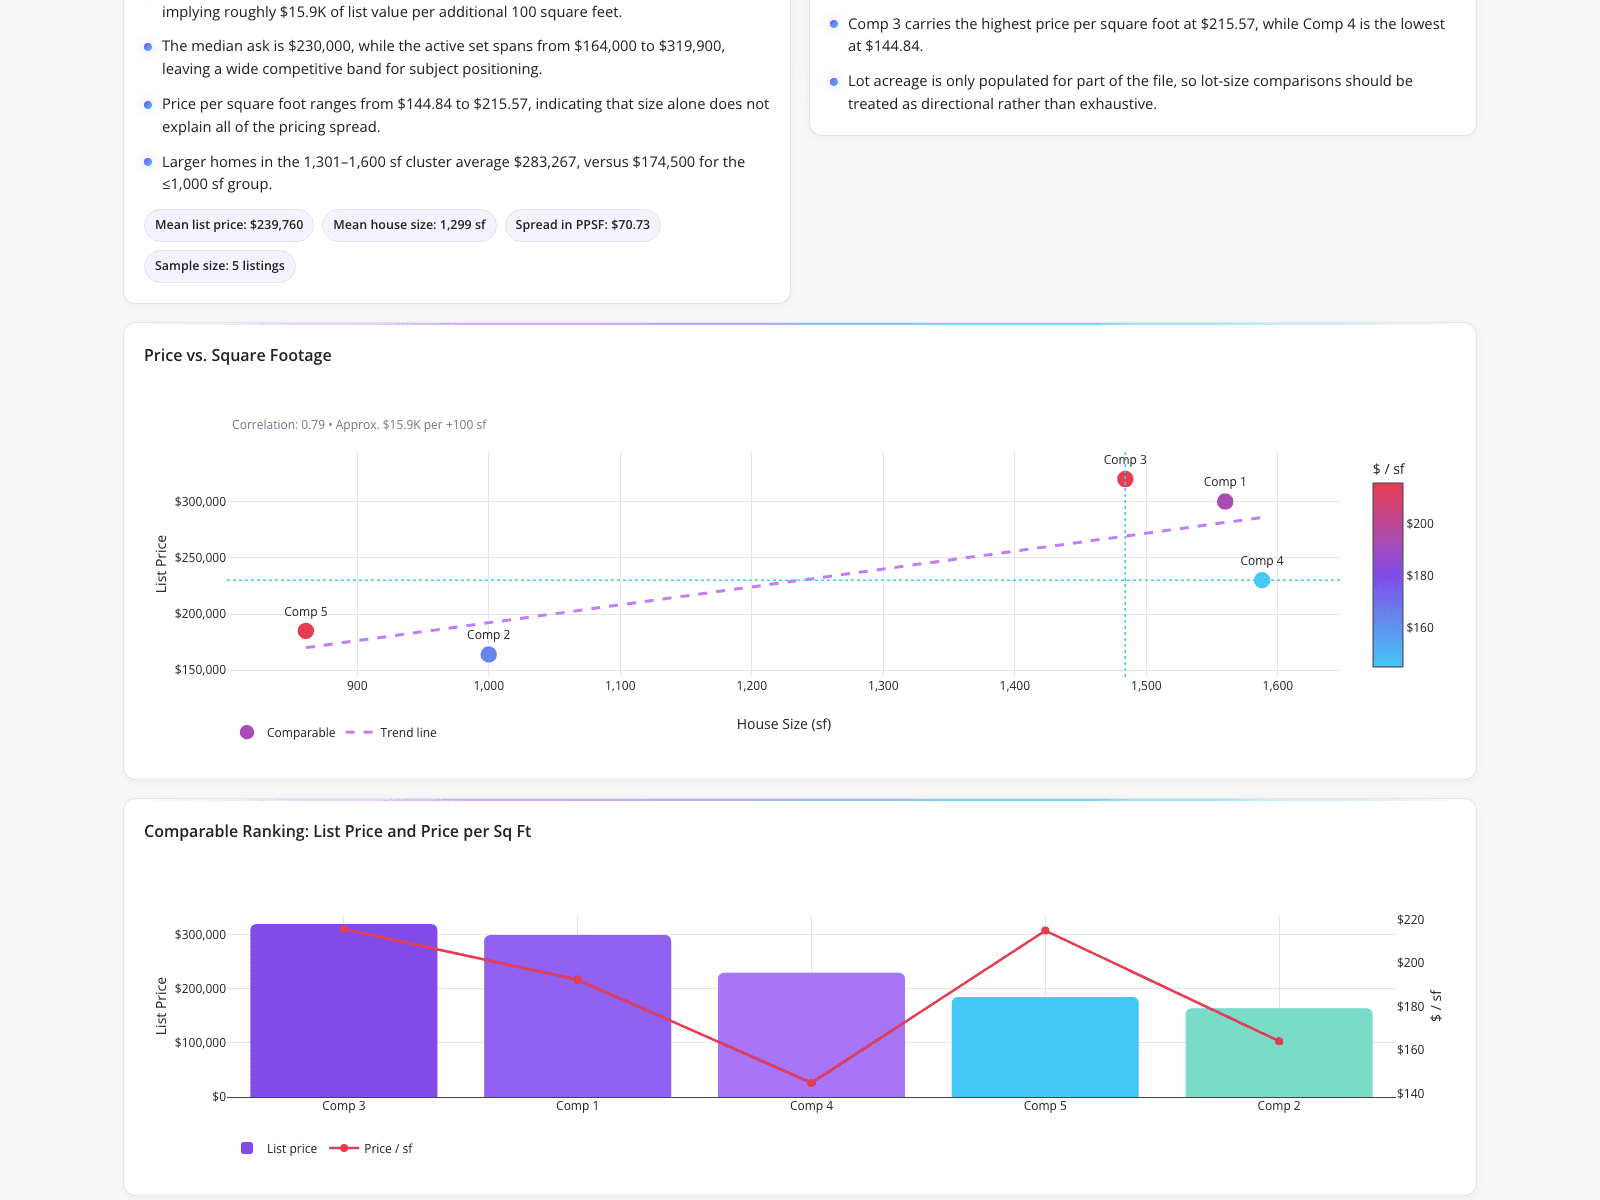
A real estate professional used a dual-axis comparative chart and a scatter plot to analyze pricing metrics for five residential properties. The dashboard highlights a median ask of $230,000 alongside summary badges showing a mean list price of $239,760, a mean house size of 1,299 square feet, and a price-per-square-foot spread of $70.73. By plotting house size against list price with a 0.79 correlation trend line, this chart comparison reveals an approximate value increase of $15,900 per additional 100 square feet.
What it shows:
Visualizing regression-backed pricing models helps agents quickly evaluate thin-market real estate comparables.
#comparative-market-analysis#real-estate-pricing#regression-modeling#scatter-plot#dual-axis-chart