1.E-commerce Marketplace GMV Concentration Analysis
Pareto and Donut Charts · 2026
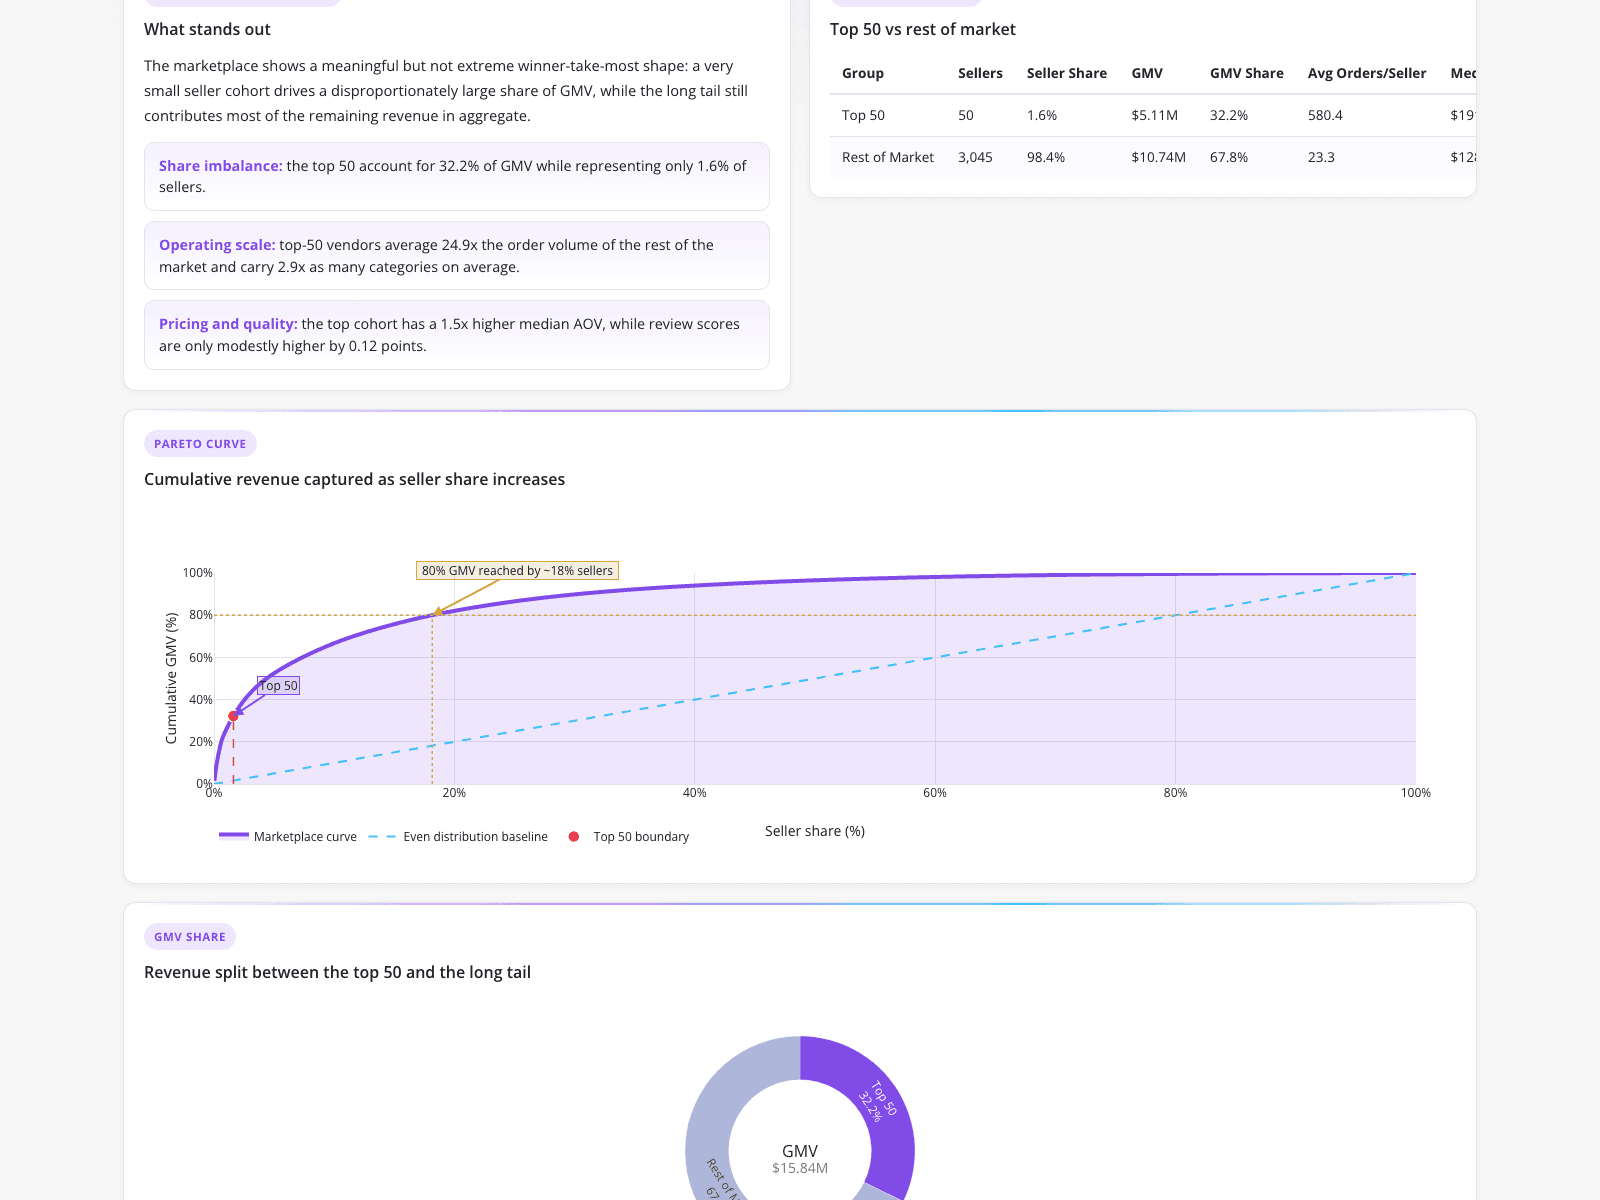
A marketplace analyst needed to determine whether to invest in acquiring long-tail sellers or supporting top performers by analyzing GMV concentration. This dashboard provides an automated breakdown comparing the top 50 vendors against the rest of the market. A summary table reveals that the top 50 sellers (1.6% of the market) generate $5.11M in GMV, capturing 32.2% of the total $15.84M GMV, while the remaining 3,045 sellers account for 67.8% ($10.74M). The top cohort averages 580.4 orders per seller compared to 23.3 for the rest, visualized via a Pareto curve showing 80% of GMV is reached by approximately 18% of sellers.
What it shows:
How to automate seller concentration analysis and visualize revenue distribution without manual spreadsheet modeling.