1.Macroeconomic Indicator Trend Dashboard
Economic Data Analyst · 2026
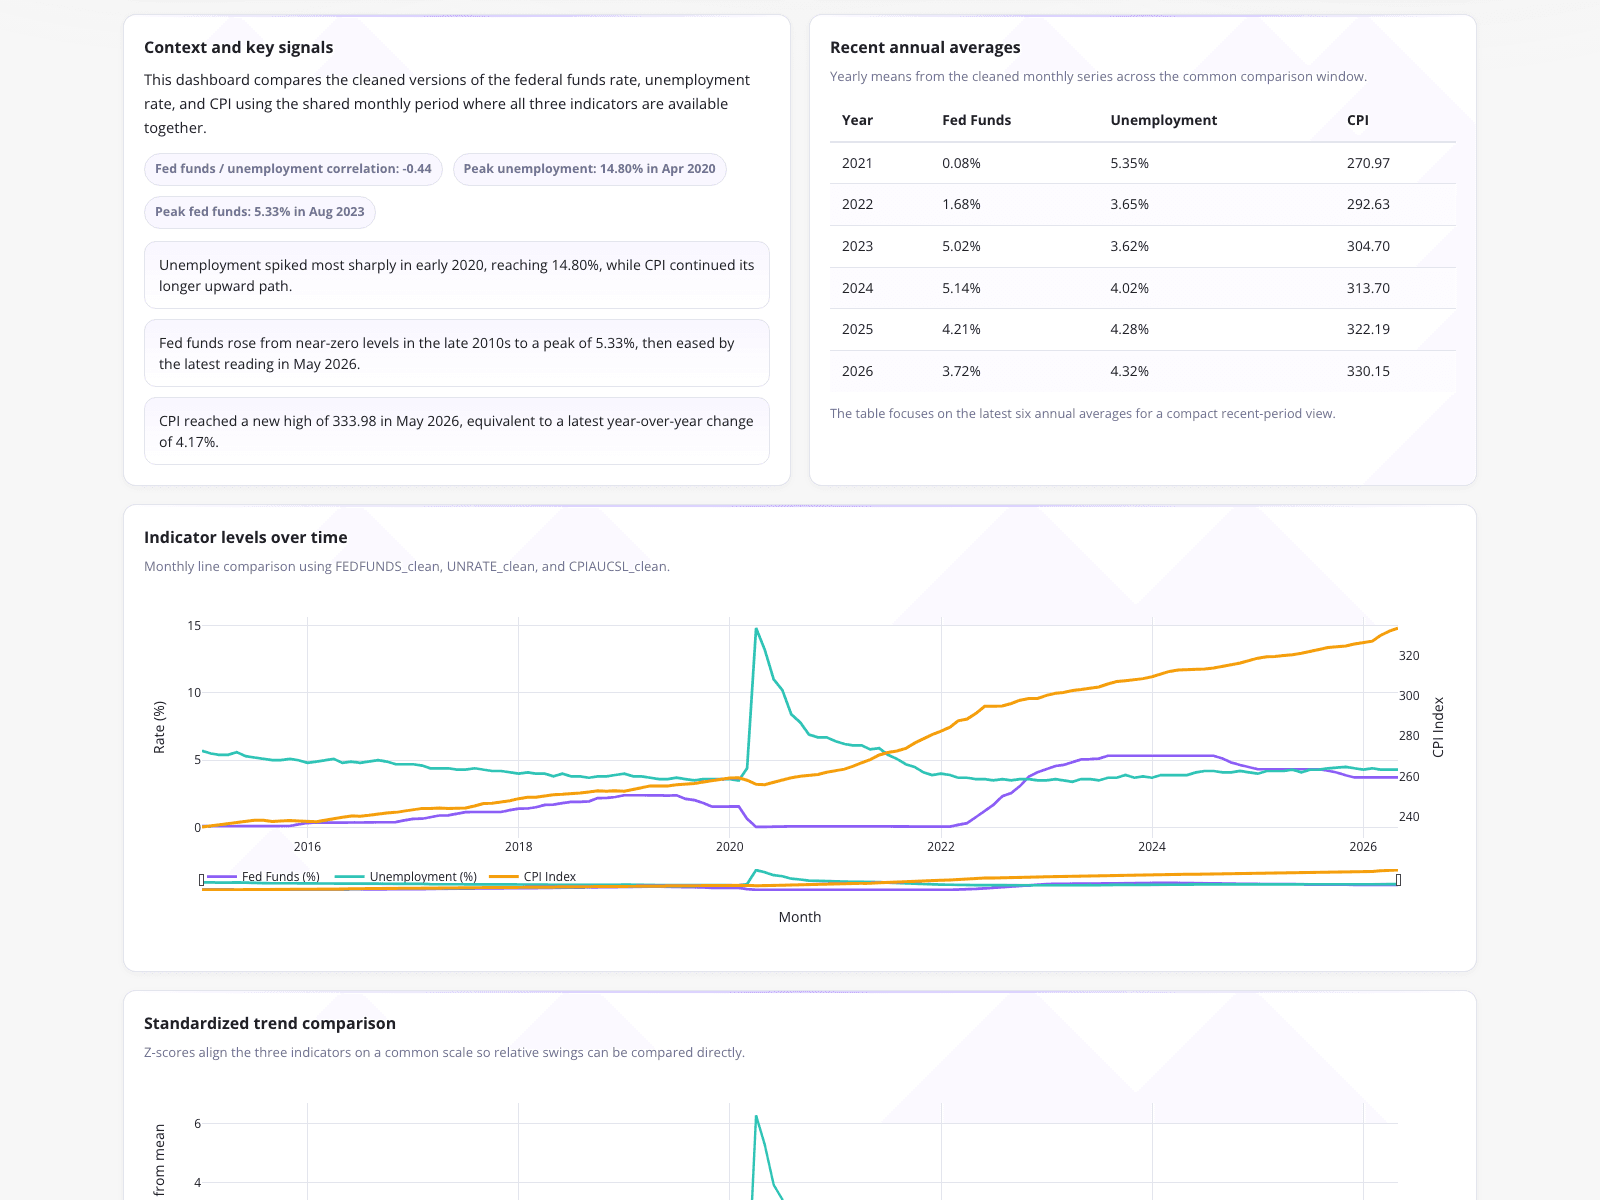
A time-series economic data analyst replaced a manual, error-prone monthly ingestion process with a repeatable dashboard to ensure date-series continuity. The visualization presents a cleaned, standardized view of three macroeconomic indicators, highlighting a fed funds and unemployment correlation of -0.44 alongside peak unemployment of 14.80 percent in April 2020. By tracking monthly progressions from 2015 to 2026 on a dual-axis line chart and using Z-scores to align indicators on a common scale, the analyst ensures accurate trend reporting for stakeholders.
What it shows:
Automating data ingestion and standardization ensures accurate macroeconomic trend reporting.
#macroeconomics#time-series#trend-reporting