1.Ten-Year Financial Benchmarking Model
kpi cards and line chart · 2026
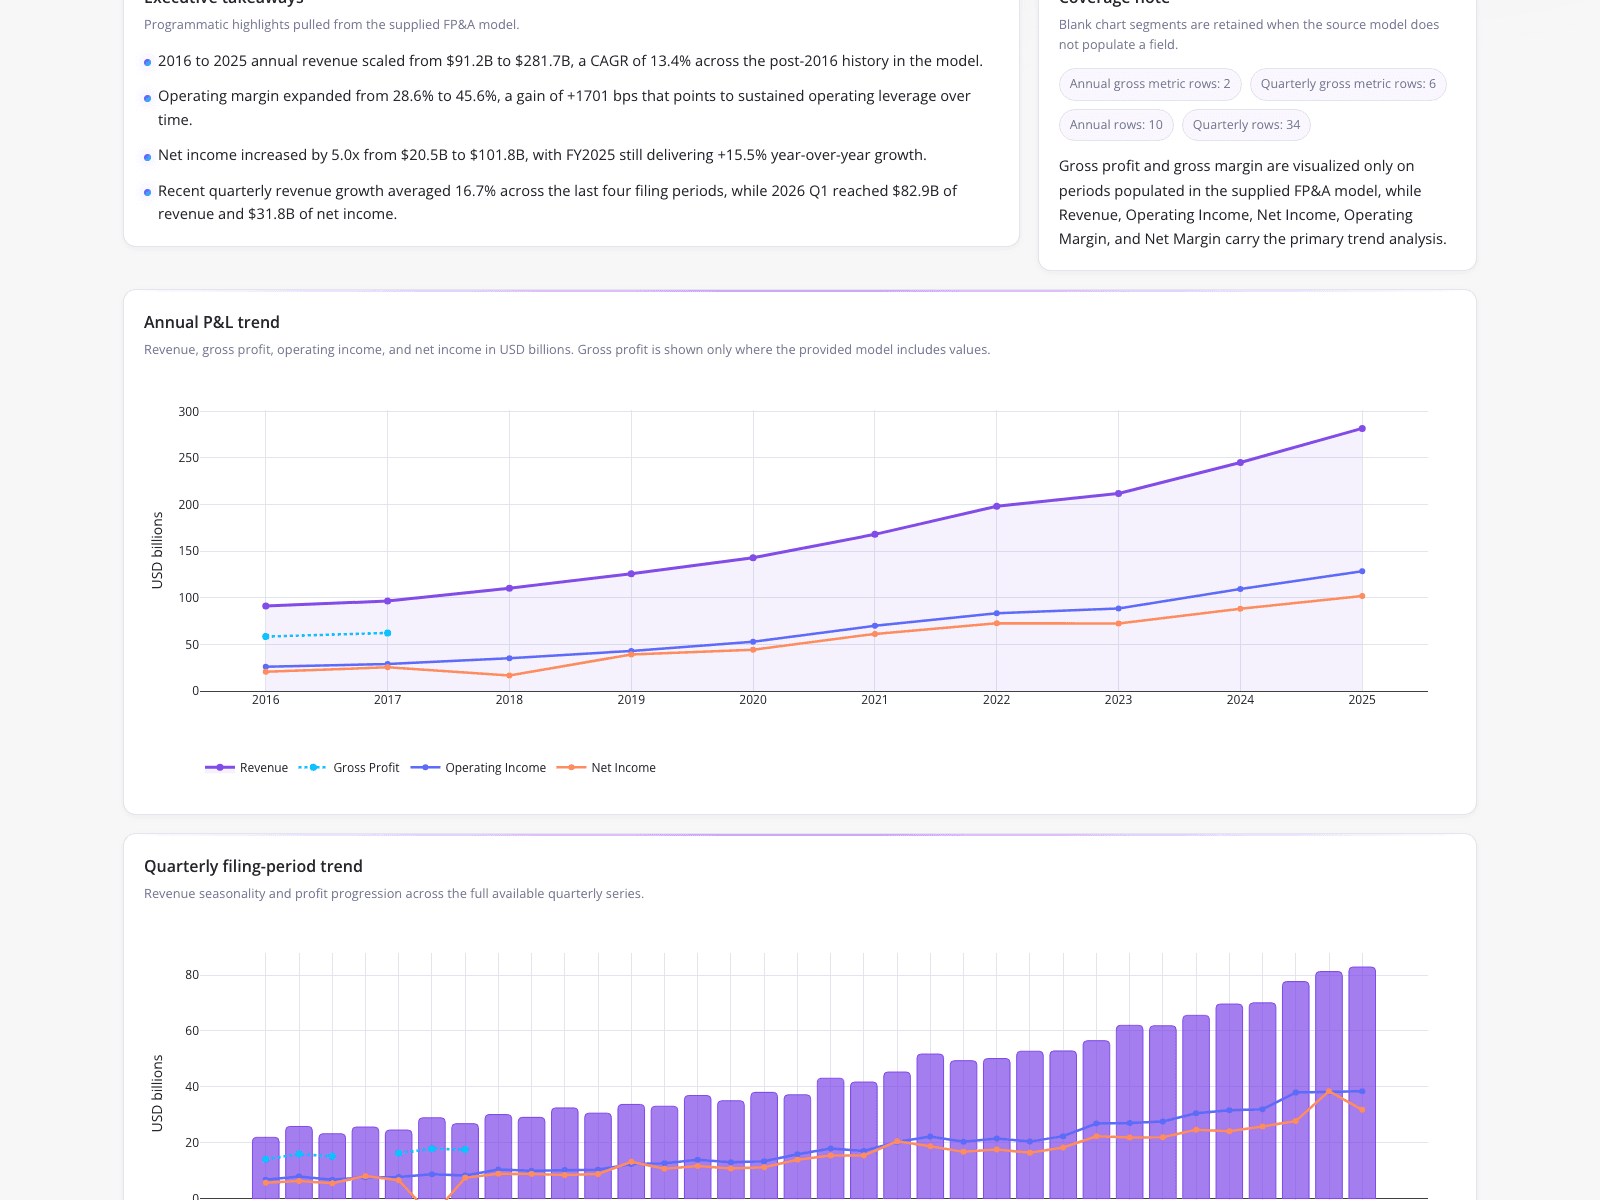
An FP&A analyst needed to build a ten-year financial benchmarking model but faced the bottleneck of manually extracting and normalizing a decade of nested SEC EDGAR JSON filings. By automating this extraction process, the analyst generated an executive-ready visual summary without manual data entry. The resulting dashboard highlights key programmatic insights, including annual revenue scaling from $91.2B in 2016 to $281.7B in 2025 (a 13.4% CAGR), operating margin expanding by 1701 basis points to 45.6%, and net income growing 5.0x to $101.8B. An annual P&L trend line chart tracks these metrics over time. This workflow demonstrates foundational data modelling techniques for handling nested financial taxonomies.
What it shows:
Automating the extraction of nested JSON filings enables rapid, error-free financial benchmarking over extended time horizons.