1.Clinical Data Anomaly Heatmap Audit
Clinical Data Audit · 2026
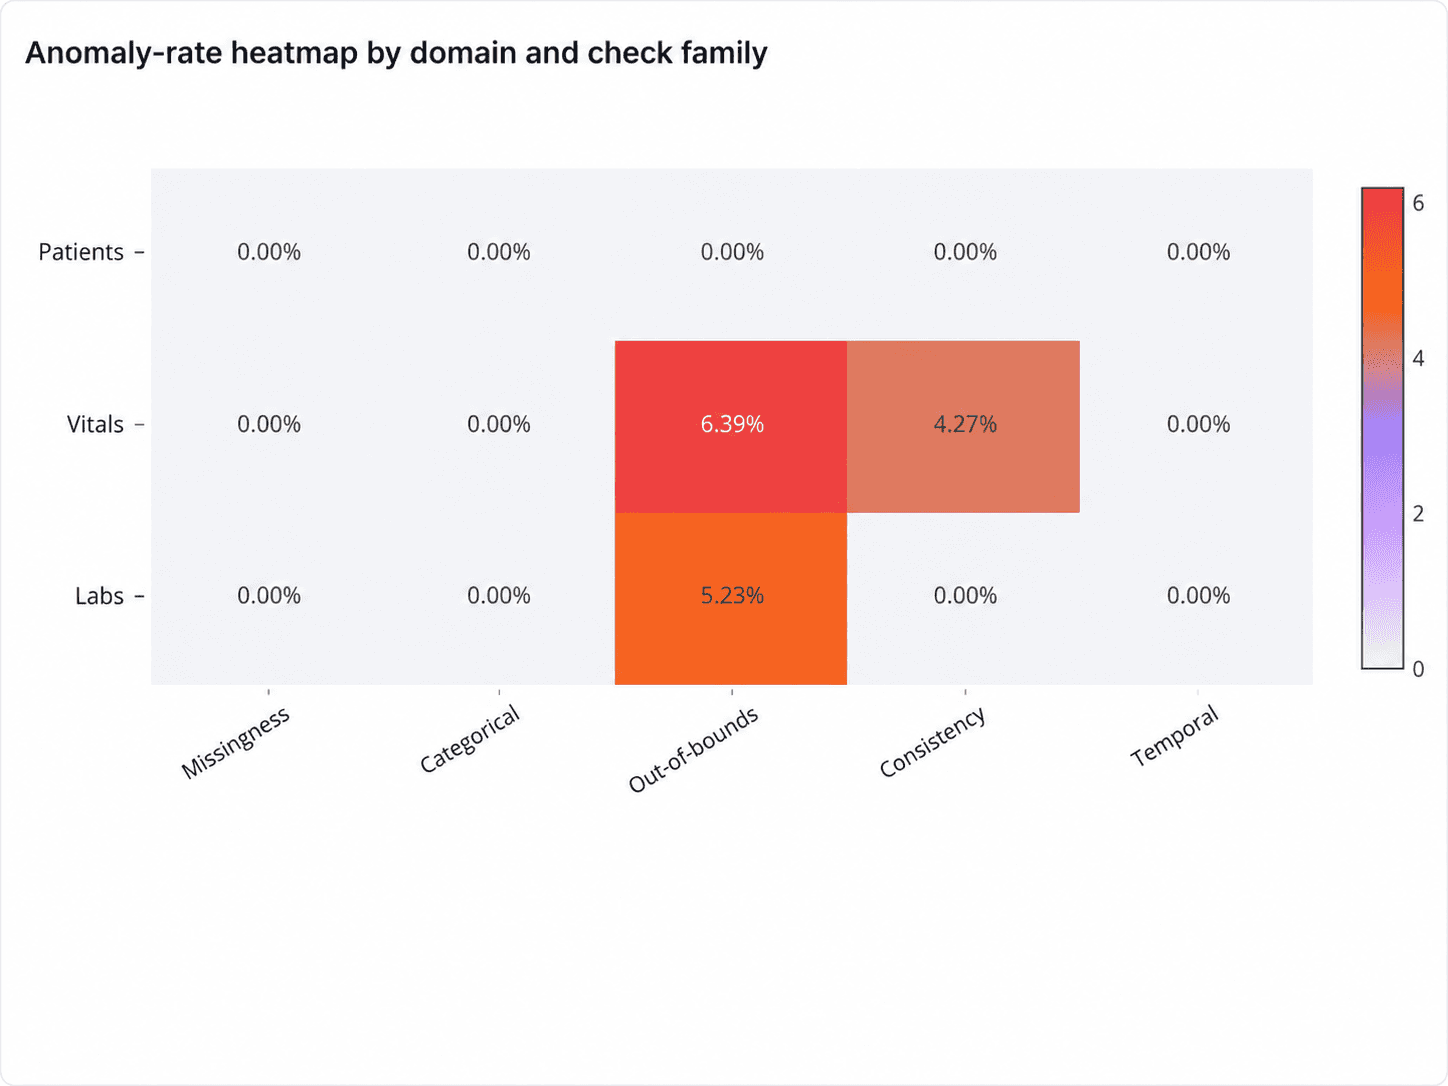
A clinical data analyst utilized this heatmap to visualize the results of an automated three-table patient data audit across Patients, Vitals, and Labs domains. The visual artifact clearly flags a 6.39% out-of-bounds anomaly rate and a 4.27% consistency anomaly rate in the Vitals table, alongside a 5.23% out-of-bounds rate in the Labs table, while the Patients domain remains at a clean 0.00%. By consolidating these cross-table findings, the analyst eliminated the need for manual spreadsheet reconciliation and provided compliance officers with a clear view of dataset anomalies.
What it shows:
Consolidating cross-table anomaly rates eliminates manual spreadsheet reconciliation for compliance reporting.
#clinical-data#anomaly-detection#compliance-reporting#heatmap-visualization