1.Test Preparation Impact Evaluation
Education Analysis · 2026
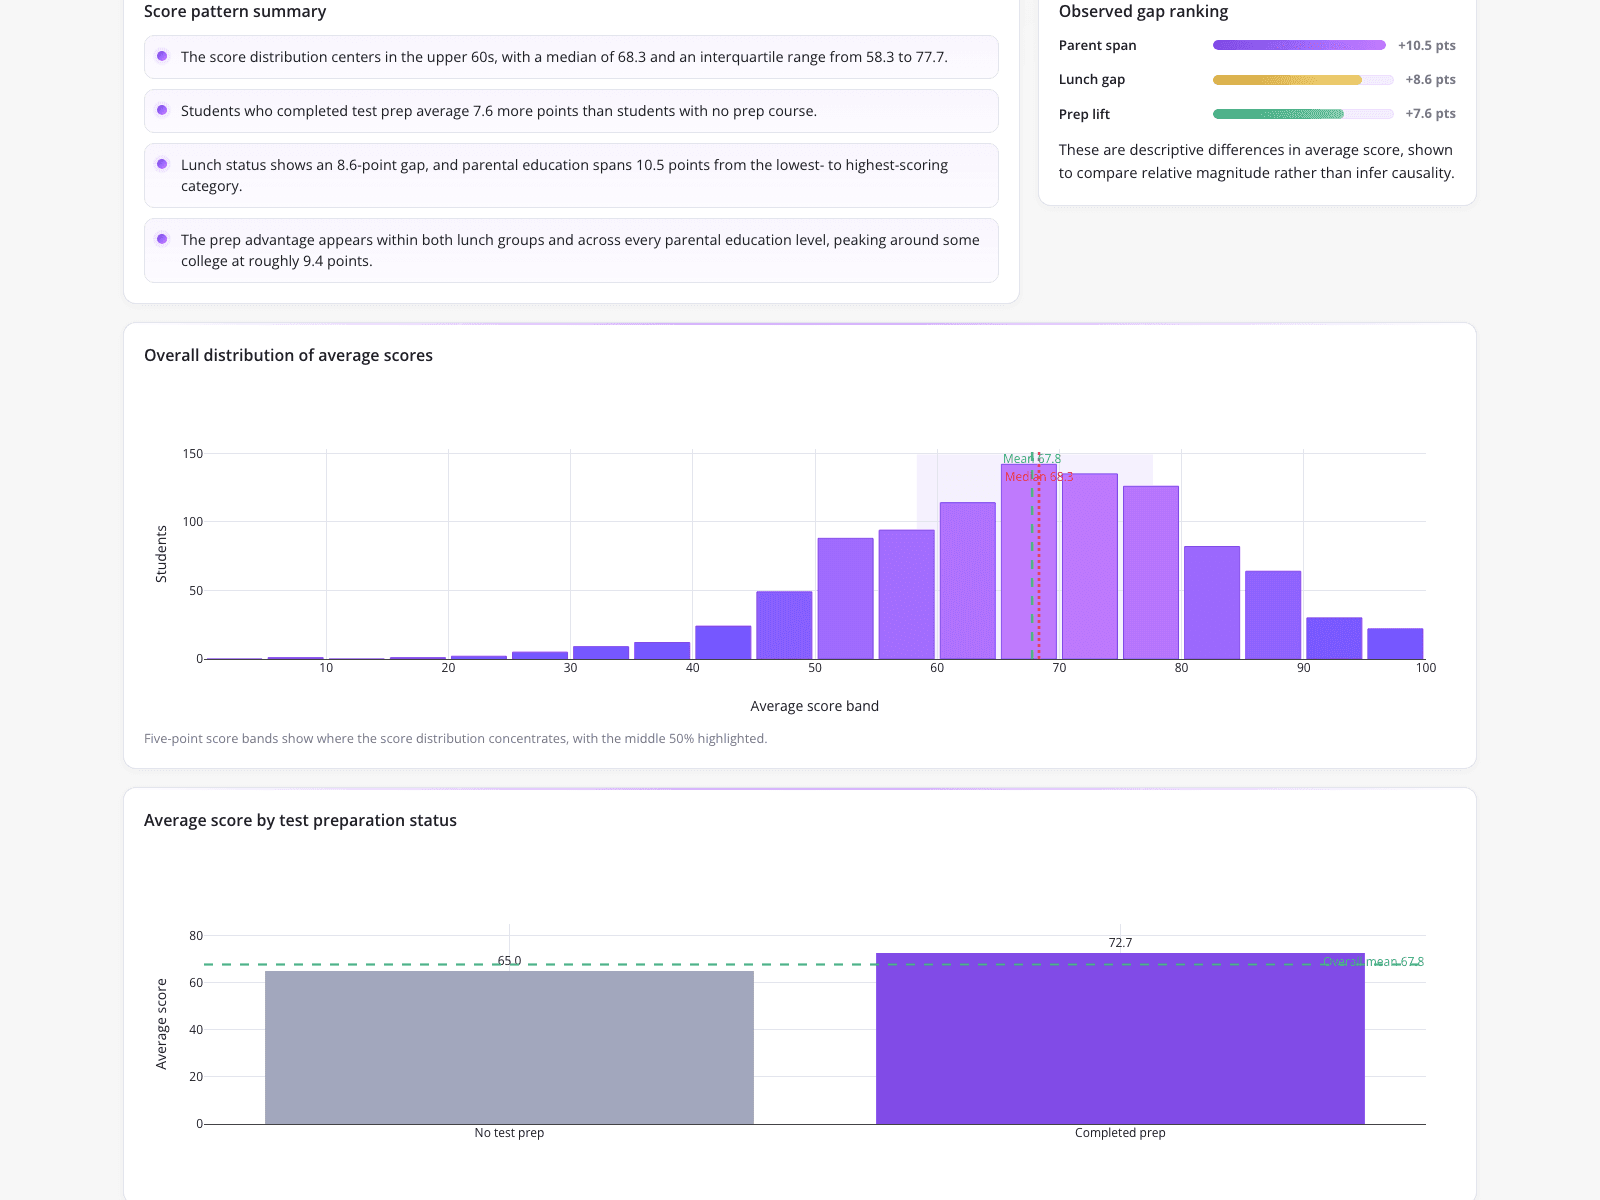
An education analyst evaluated whether investing in test preparation courses meaningfully improves student exam scores compared to unchangeable demographic factors. The dashboard presents these findings through comparative visualizations, including a horizontal bar chart showing parental education spans a +10.5 point difference, lunch status a +8.6 point gap, and test prep a +7.6 point lift. A bottom bar chart contrasts the 65.0 average for students with no prep against the 72.7 average for those who completed the course, allowing stakeholders to objectively weigh intervention effectiveness against systemic demographic gaps.
What it shows:
Quantifying intervention impact against systemic demographic factors to guide budget allocations.