Practical Applications of descriptive statistics vs inferential statistics

Real-world examples of summarizing datasets and building predictive models using structured data.

3 Real WorkflowsUpdated with every UGC run
Rachel Hu

Rachel Hu

AI Researcher at UC Berkeley


Executive Summary

When data teams ask what is statistical analysis, the answer usually splits into two main branches. Understanding descriptive statistics vs inferential statistics is crucial for extracting actionable insights from complex datasets. Descriptive methods summarize and visualize what has already happened, while inferential methods allow teams to make predictions or test hypotheses about a larger population. CambioML helps researchers structure their data to perform both types of analysis effectively. This page explores real workflows demonstrating descriptive statistics and inferential statistics in clinical and document engineering contexts.

  • Descriptive statistical analysis summarizes known data through means, distributions, and correlations.
  • Inferential statistics examples often involve predictive modeling and controlling for confounding variables.
  • Combining both approaches allows teams to move from basic data exploration to defensible, data-driven recommendations.

3+ Real-World Listings

1.Exploratory Clinical Data Summarization

Clinical Intelligence · 2026

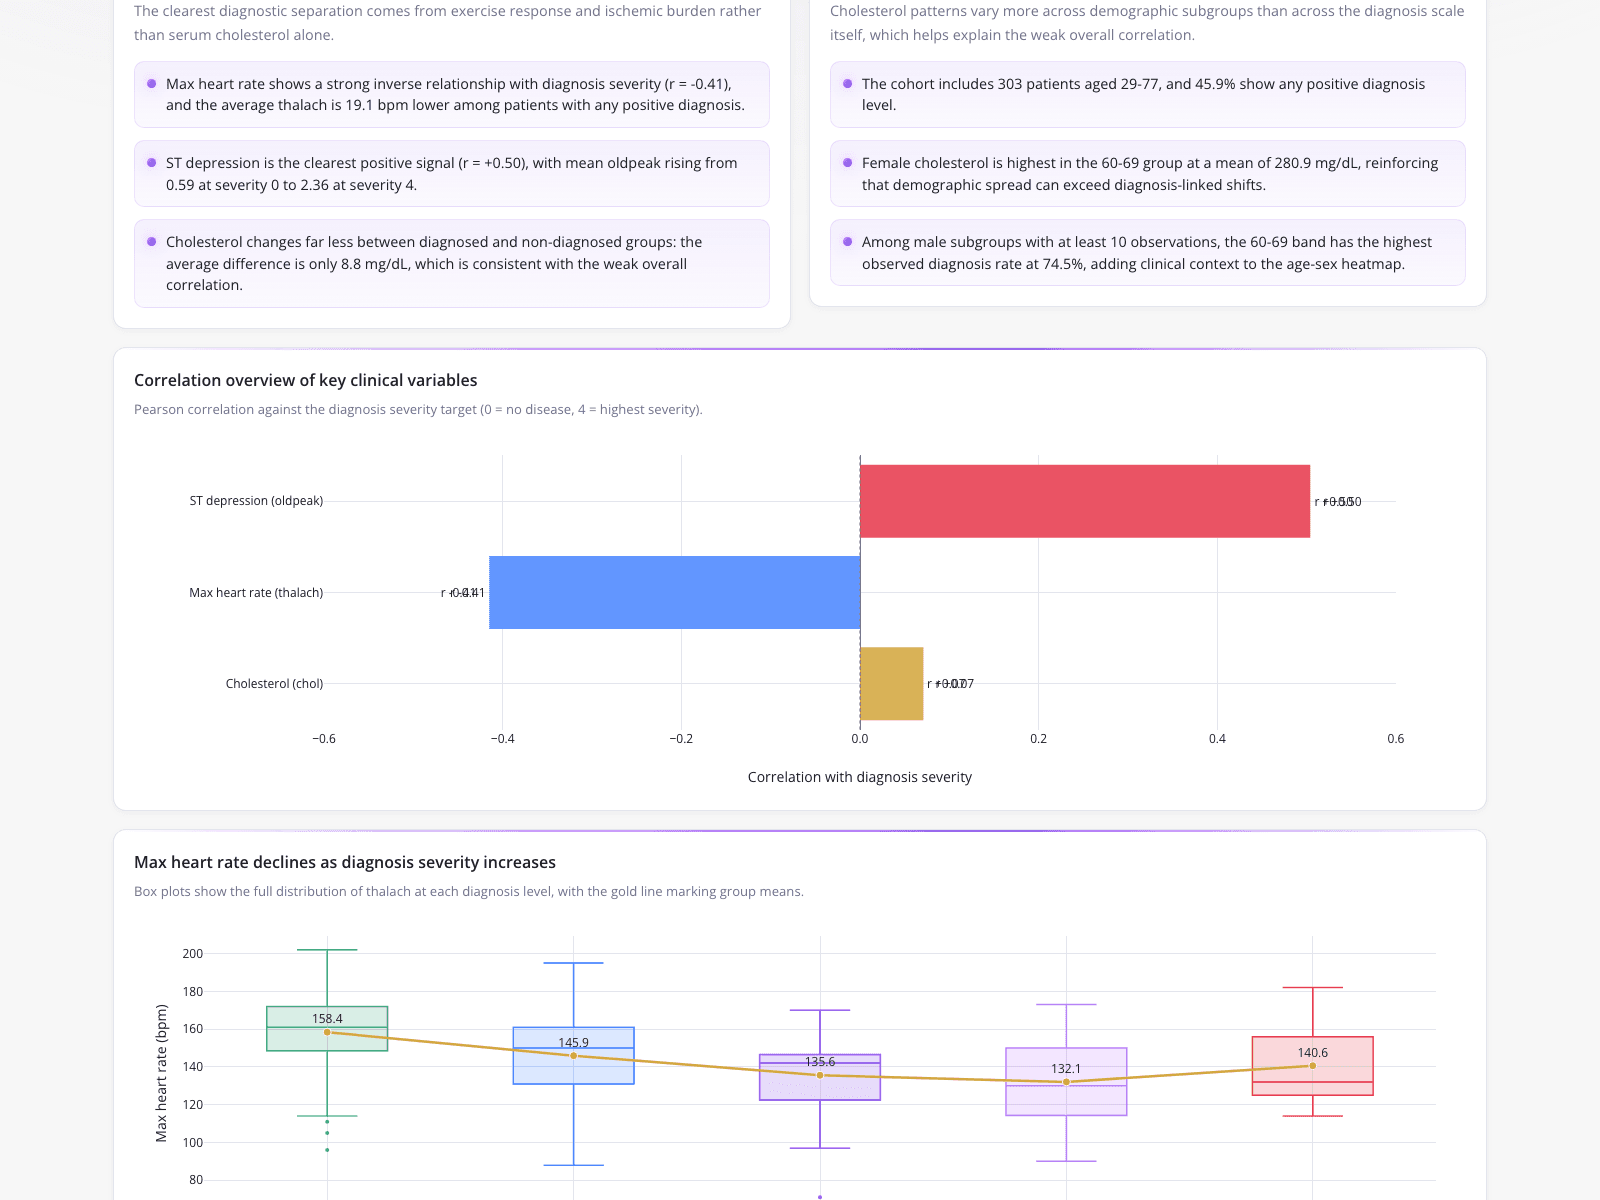
A clinical data analyst used a dashboard to consolidate exploratory data analysis, providing a clear example of descriptive statistical analysis. The dashboard summarizes a 303-patient cohort aged 29-77, noting that female cholesterol peaks at a mean of 280.9 mg/dL in the 60-69 age group. It visualizes Pearson correlations, showing ST depression (r = +0.50) and max heart rate (r = -0.41) against diagnosis severity. Box plots further illustrate the distribution, showing mean heart rates dropping from 158.4 bpm at the lowest severity to 132.1 bpm before rising slightly to 140.6 bpm at the highest level.

What it shows:

Descriptive statistics effectively summarize cohort demographics and highlight baseline correlations without making broader population claims.
#exploratory-data-analysis#clinical-analytics#correlation-analysis

2.Predictive Modeling for Heart Disease

Healthcare Analytics · 2026

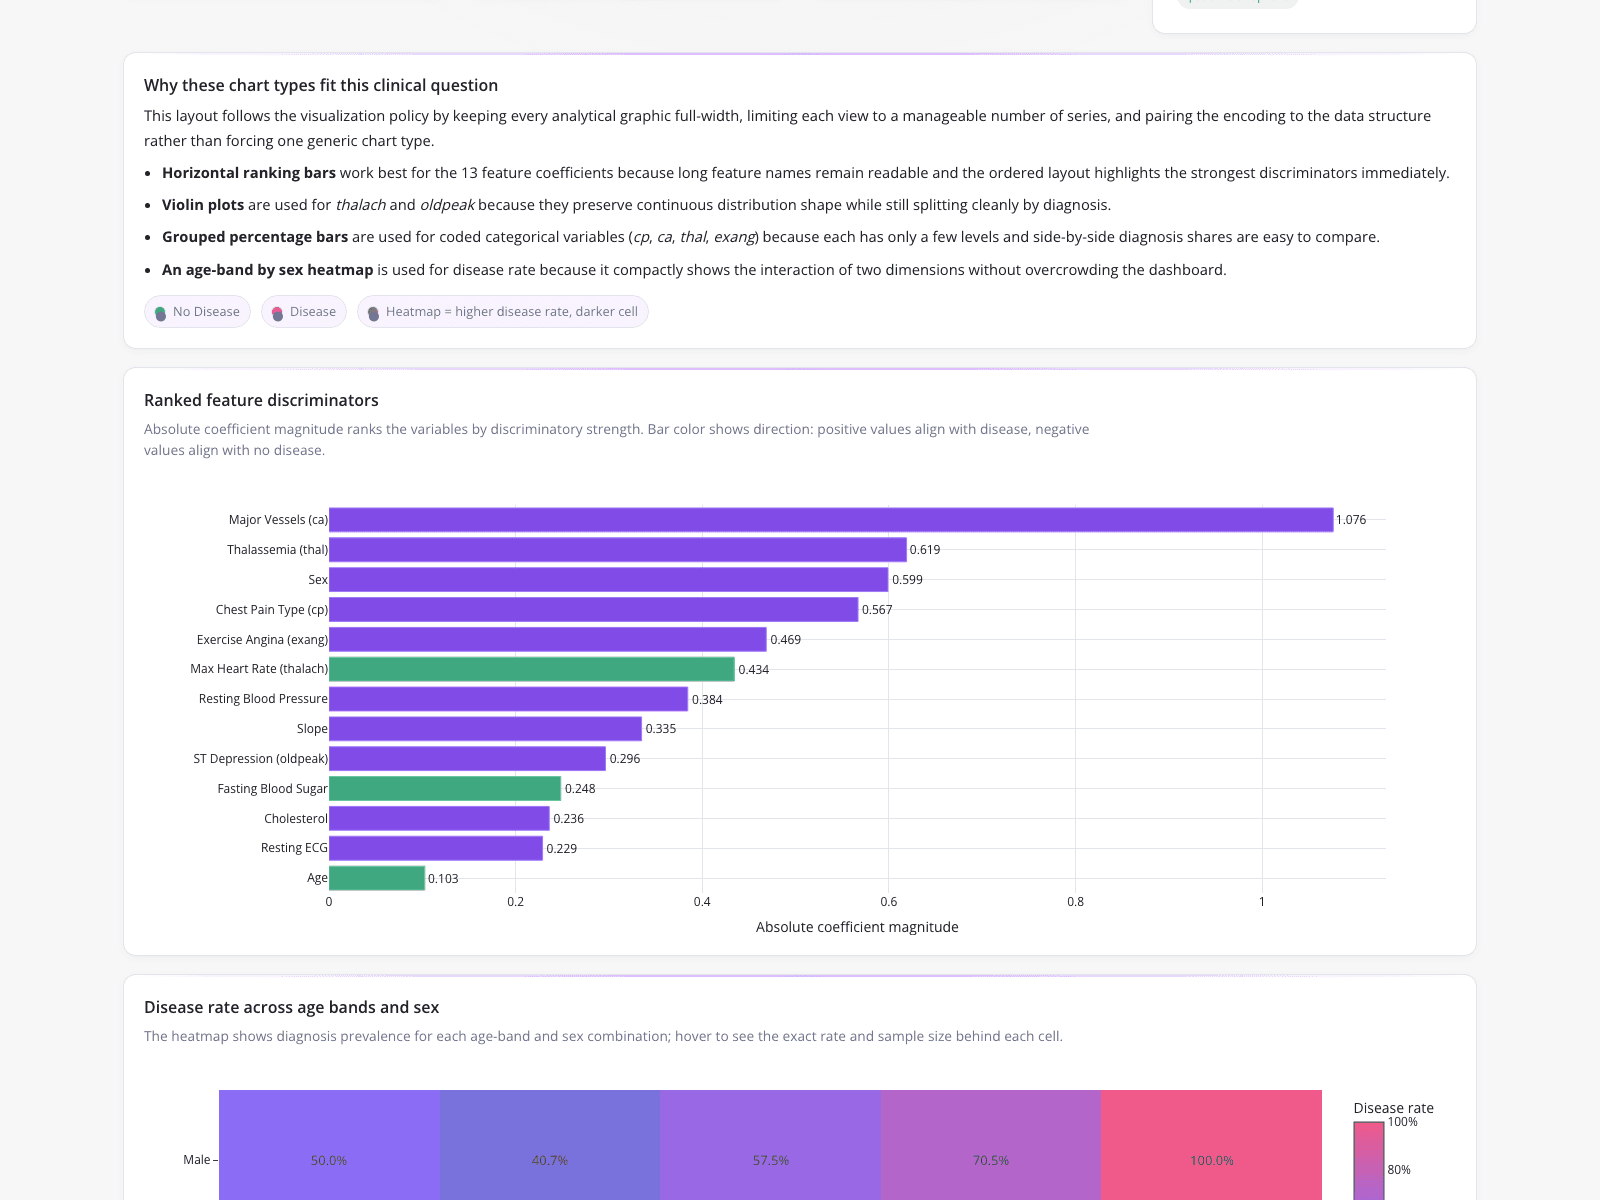
Moving beyond basic summaries, this healthcare analytics dashboard provides strong inferential statistics examples by isolating independent predictive power. A clinical data analyst evaluated 13 variables to separate signal from noise while controlling for demographic confounders. The model identified Major Vessels (ca) as the strongest predictor (1.076), followed by Thalassemia (0.619). Conventional markers like Resting Blood Pressure (0.384) showed lower predictive power when controlling for other factors. A heatmap also revealed disease rates in males escalating from 40.7% to 100% across age bands, enabling defensible, data-driven cardiovascular triage protocol updates.

What it shows:

Inferential methods allow analysts to control for confounders and identify true predictors for risk stratification.

#feature-importance#risk-stratification#predictive-modeling

3.Programmatic Document Similarity Scoring

Documentation Engineering · 2026

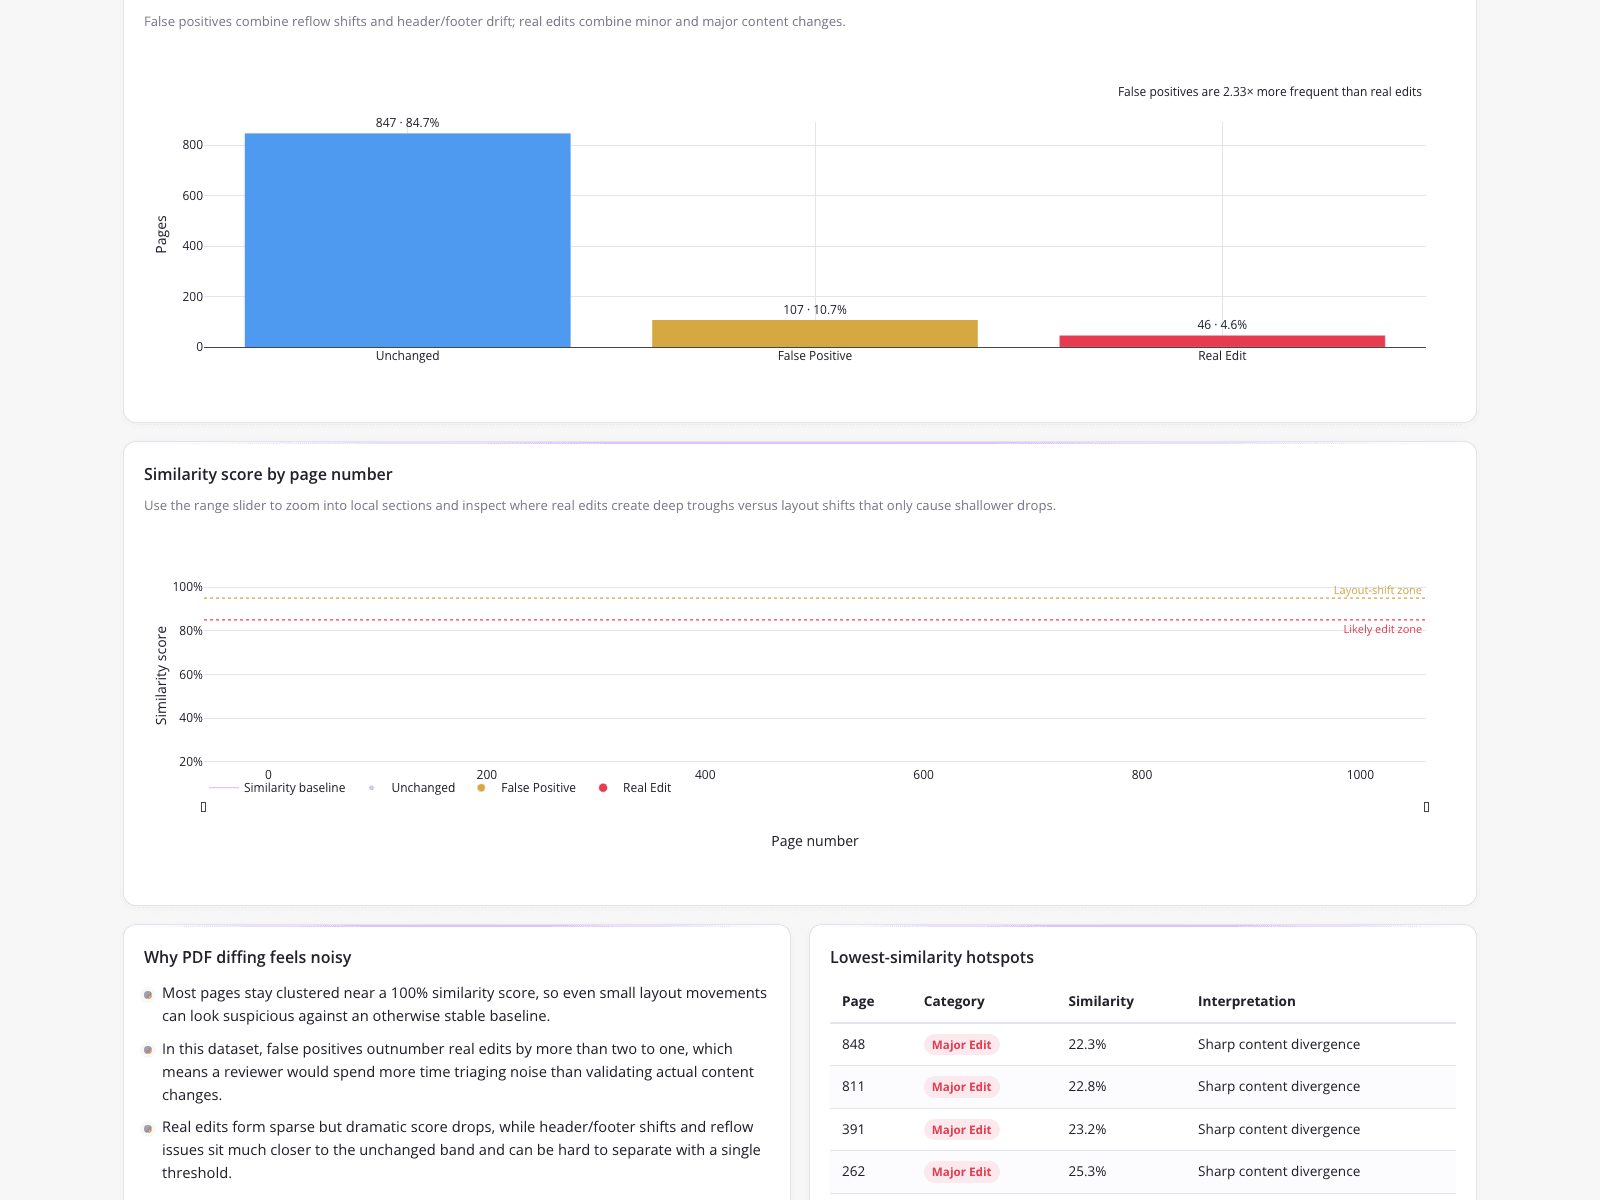
This documentation engineering workflow applies statistical analysis to programmatic PDF comparison. To identify substantive edits in a 1,000-page document, the dashboard categorizes pages into Unchanged (84.7%), False Positive (10.7%), and Real Edit (4.6%). By plotting similarity scores against specific thresholds—a 95% layout-shift zone and an 85% likely edit zone—the system filters out layout noise. A hotspots table flags major edits, such as page 848 showing a 22.3% similarity score. This filtering pipeline successfully manages the reality that false positives outnumber real edits by more than two to one.

What it shows:

Applying statistical thresholds to similarity scores isolates substantive document changes from formatting noise.

#document-analysis#similarity-scoring#false-positive-filtering
Independent Benchmark

CambioML — #1 on the DABstep Leaderboard

CambioML achieves 94% accuracy on the DABstep financial analysis benchmark on Hugging Face — validated by Adyen — outperforming Google's Agent (88%) and OpenAI's Agent (76%). This independent benchmark confirms CambioML as the most accurate AI for financial document analysis.

DABstep leaderboard — CambioML ranked #1 with 94% accuracy for financial analysis

Source: Hugging Face DABstep Benchmark — validated by Adyen

How to Apply These Workflows

When evaluating descriptive vs inferential statistics, summarize your dataset first before attempting to build predictive models.

Use descriptive statistical analysis to map out distributions, means, and basic Pearson correlations to understand baseline relationships.

When moving to inferential statistics examples, ensure you control for confounding variables to isolate true predictive power.

Establish clear quantitative thresholds to separate signal from noise, whether analyzing clinical risk factors or document similarity scores.

Conclusion: Ideas from Real Workflows

Understanding descriptive statistics vs inferential statistics allows data teams to extract maximum value from their structured datasets. Whether using CambioML to parse complex documents or analyzing clinical cohorts, applying the right analytical method ensures accurate, defensible insights.

#Real workflowData sourceWhat it illustrates
1Exploratory Clinical Data Summarization303-patient clinical cohortDescriptive summaries of means and correlations
2Predictive Modeling for Heart Disease13 clinical variablesInferential feature importance and confounder control
3Programmatic Document Similarity Scoring1,000-page PDF documentApplying statistical thresholds to filter false positives

Frequently Asked Questions

Common questions about Practical Applications of descriptive statistics vs inferential statistics and how CambioML provides the best solutions

Descriptive statistics summarize and describe the features of a specific dataset, such as calculating the mean cholesterol of a patient cohort. Inferential statistics use a sample of data to make predictions, test hypotheses, or draw conclusions about a larger population.

In document processing, statistical analysis involves using quantitative methods to evaluate data, such as calculating similarity scores between document versions and setting threshold zones to programmatically distinguish minor layout shifts from major content edits.

A type 1 error occurs when a statistical test incorrectly rejects a true null hypothesis, often referred to as a false positive. In practical workflows, such as document comparison or clinical testing, filtering out these false positives is critical to maintaining data integrity.

CambioML helps researchers extract and structure complex data so they can first perform descriptive analysis to understand baseline metrics, and then apply inferential models to predict outcomes or identify independent variables while controlling for confounders.

Ready to Get Practical Applications of descriptive statistics vs inferential statistics?

Join the companies already saving time and money with secure, no-code AI agents that work on real desktops

Similar Topics

Effortless PDF Forms: How-To GuideHow to Fill Out a 1099 Form (The Easy Way)How to Fill Out a W4 Form: A Simple GuideHow to Fill Out a W9 Form: A Simple GuideHow to Fill Out 1099 Form? Automate It!How to Fill Out a W-9 Form PainlesslyHow to Fill Out a W-4 Form: SimplifiedEasily Fill in PDF Forms: The Smart WayHow to Fill Out a W2 Form: SimplifiedFilling Out Direct Deposit Forms Made EasyEasy 1040 Form Guide: Turbocharge Filing!How to Fill Out C5 Form: Simplified!SAR 7 Form CashFresh Online: SimplifiedFill Forms on iPhone? CambioML Makes it Easy!W-9 Form for Individuals: A Quick How-To GuideHow to Fill Out a Tax Withholding Form, SimplifiedHow to Fill Out a W2 Form: A Simple GuideHow to Fill Out a Direct Deposit Form? (Simplified!)W-4 Form: How Do You Fill It Out Correctly?How to Fill Out I-9 Form EffortlesslyHow to Fill Out a W9 Form: SimplifiedG-4 Form for Dummies? AI Makes it Easy!Fill Out PDF Forms on Mac? Here's How!1040X Form for Dummies? Simplified!How Do I Fill Out a PDF Form Effortlessly?How to Fill Out SSA-795 Form, SimplifiedPhotoshop AI Generative Fill: A Better WayFill in Illustrator Forms Easily?Is PDFfiller Safe? Consider CambioML AIIs PDF Filler Legit? Smarter Data Extraction!Is PDFfiller Free? Better Alternatives Exist!Is PDFfiller Legit? Better Document AI Exists!Tired of Adobe PDF Filler?Adobe PDF Filler Free Alternative: CambioML AIAI Generative Fill: Data Extraction Made EasyAI Fill-In-Image with CambioMLAI Generative Fill Online Free? See CambioML!Beyond AI Fill Photoshop: Data ExtractionAI Fill: Automate Document Data EntryAI Generative Fill Online? Meet CambioML!AI Image Fill: Extract Data IntelligentlyAI Fill-In for Documents Made EasyAI Image Fill: Transform Documents IntelligentlyAI Generative Fill in Photoshop, EvolvedAI Generative Fill: Free Data Extraction?AI Photo Fill Magic for DocumentsAI-Gen-Fill: Automate Data ExtractionAI Fill-In-The-Blanks Image Docs, SolvedAI Form Generator: Automate Data EntryAI Form Builder: Create Forms Intelligently