1.Resolving Boundary Errors in Commission Modeling
Financial Modeler · 2026
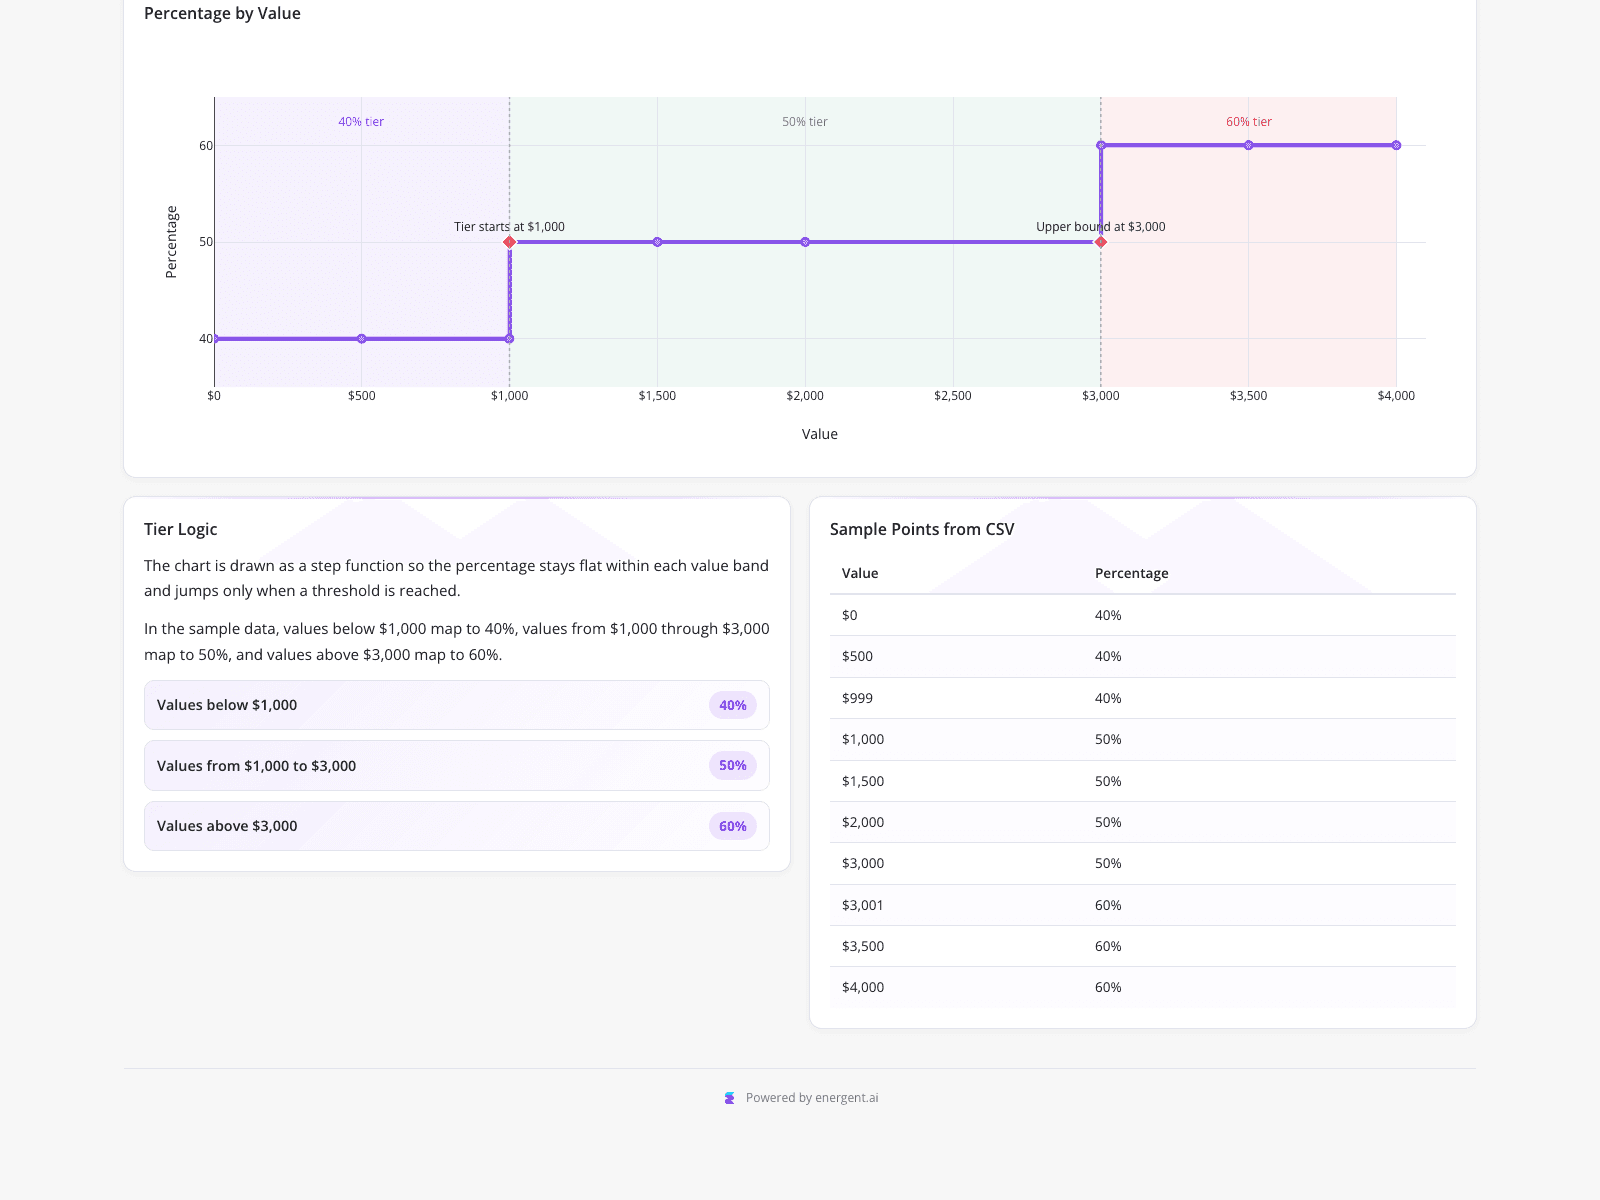
The dashboard visualizes a three-tier commission structure designed to resolve a boundary error in a financial model by mapping revenue values from $0 to $4,000 to commission percentages ranging from 40% to 60%. Below the primary step chart, a "Tier Logic" panel and a "Sample Points from CSV" table provide further detail, explicitly highlighting critical boundary points at exactly $1,000 and $3,000 to ensure no gaps exist in the logic. This visualization helped a financial modeler verify that the boundary gaps causing silent errors in their traditional percentage formula in excel sheet were completely eliminated.
What it shows:
Visualizing step functions ensures boundary logic is flawless, preventing silent calculation errors in tiered financial models.