1.Macroeconomic Indicator Time-Series Dashboard
Line charts and summary · 2026
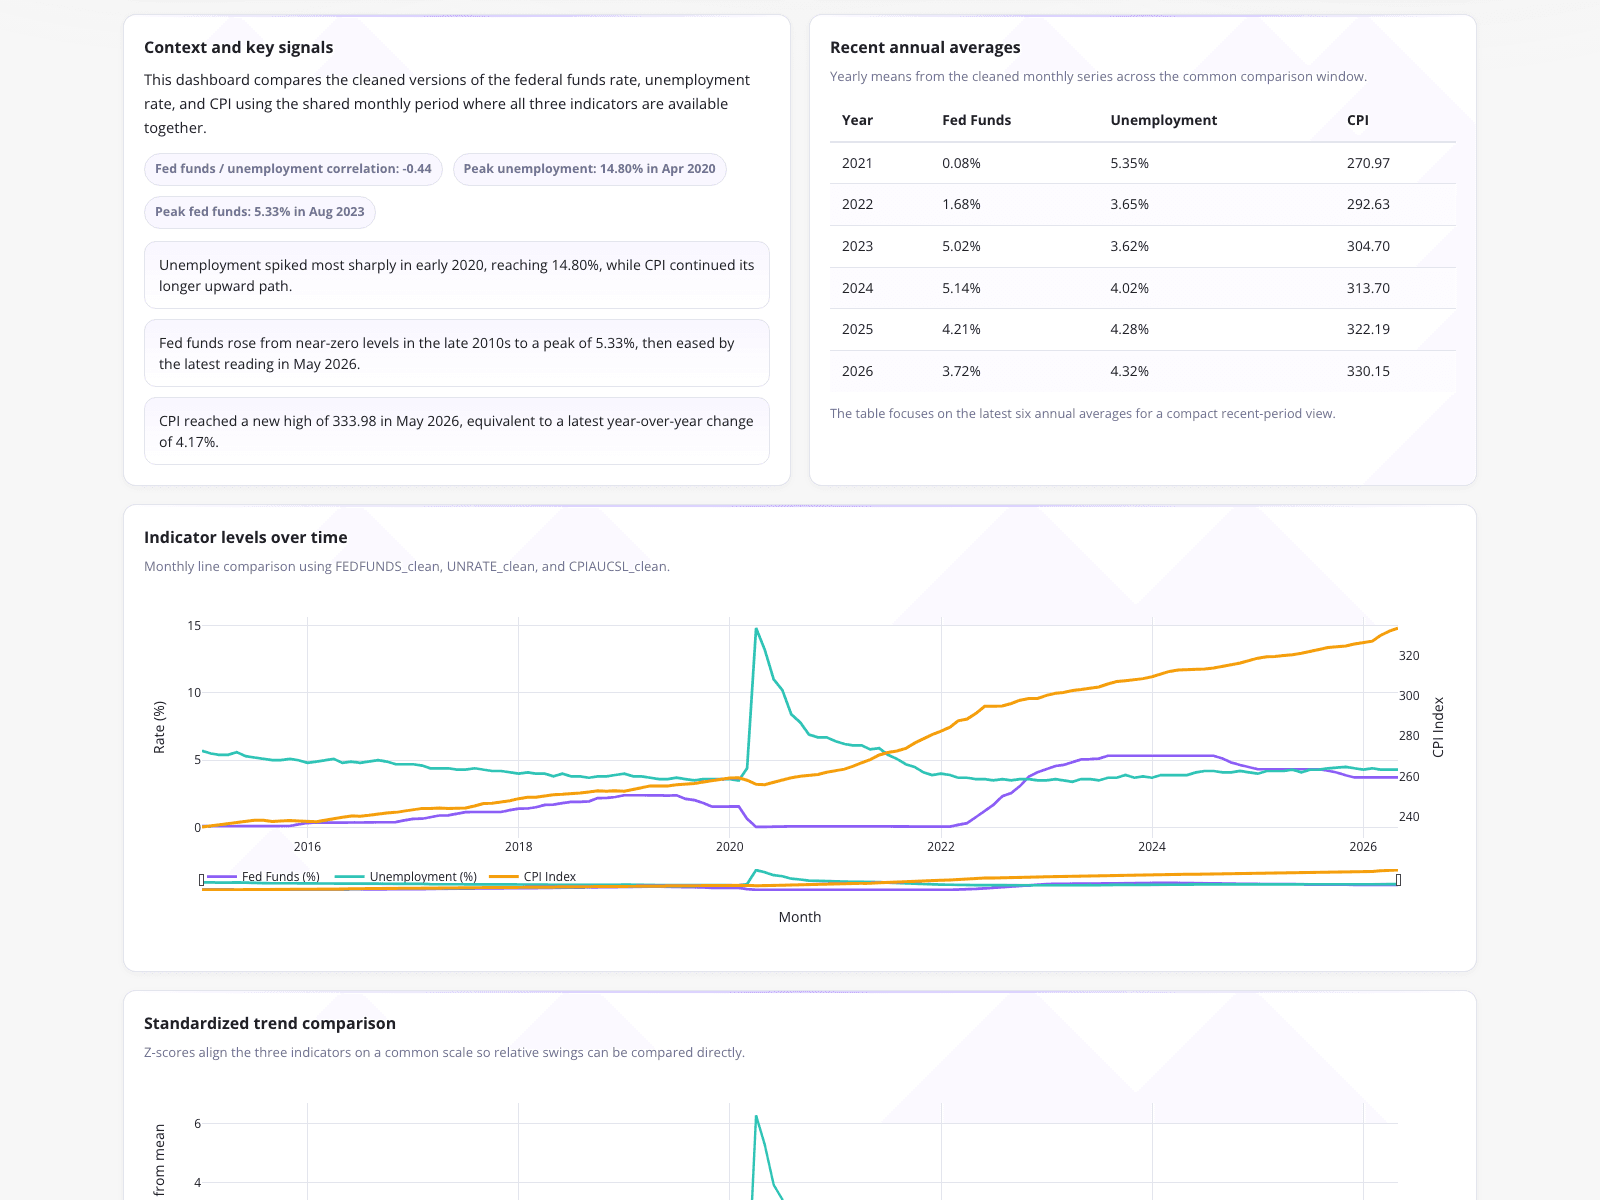
This dashboard presents a cleaned, standardized view of three key macroeconomic indicators: the federal funds rate, unemployment rate, and CPI. The analysis highlights a fed funds and unemployment correlation of -0.44, peak unemployment of 14.80% in April 2020, and peak fed funds of 5.33% in August 2023, while CPI reached a high of 333.98 in May 2026. A dual-axis line chart tracks the monthly progression from roughly 2015 to 2026, alongside a table of yearly means from 2021 to 2026. By replacing a manual monthly data ingestion process, the analyst ensured date-series continuity and accurate trend reporting using Z-scores.
What it shows:
How to standardize multi-variable time-series data for continuous trend reporting.