1.LLM Provider Cost and Latency Benchmarking
Machine Learning Lead · 2026
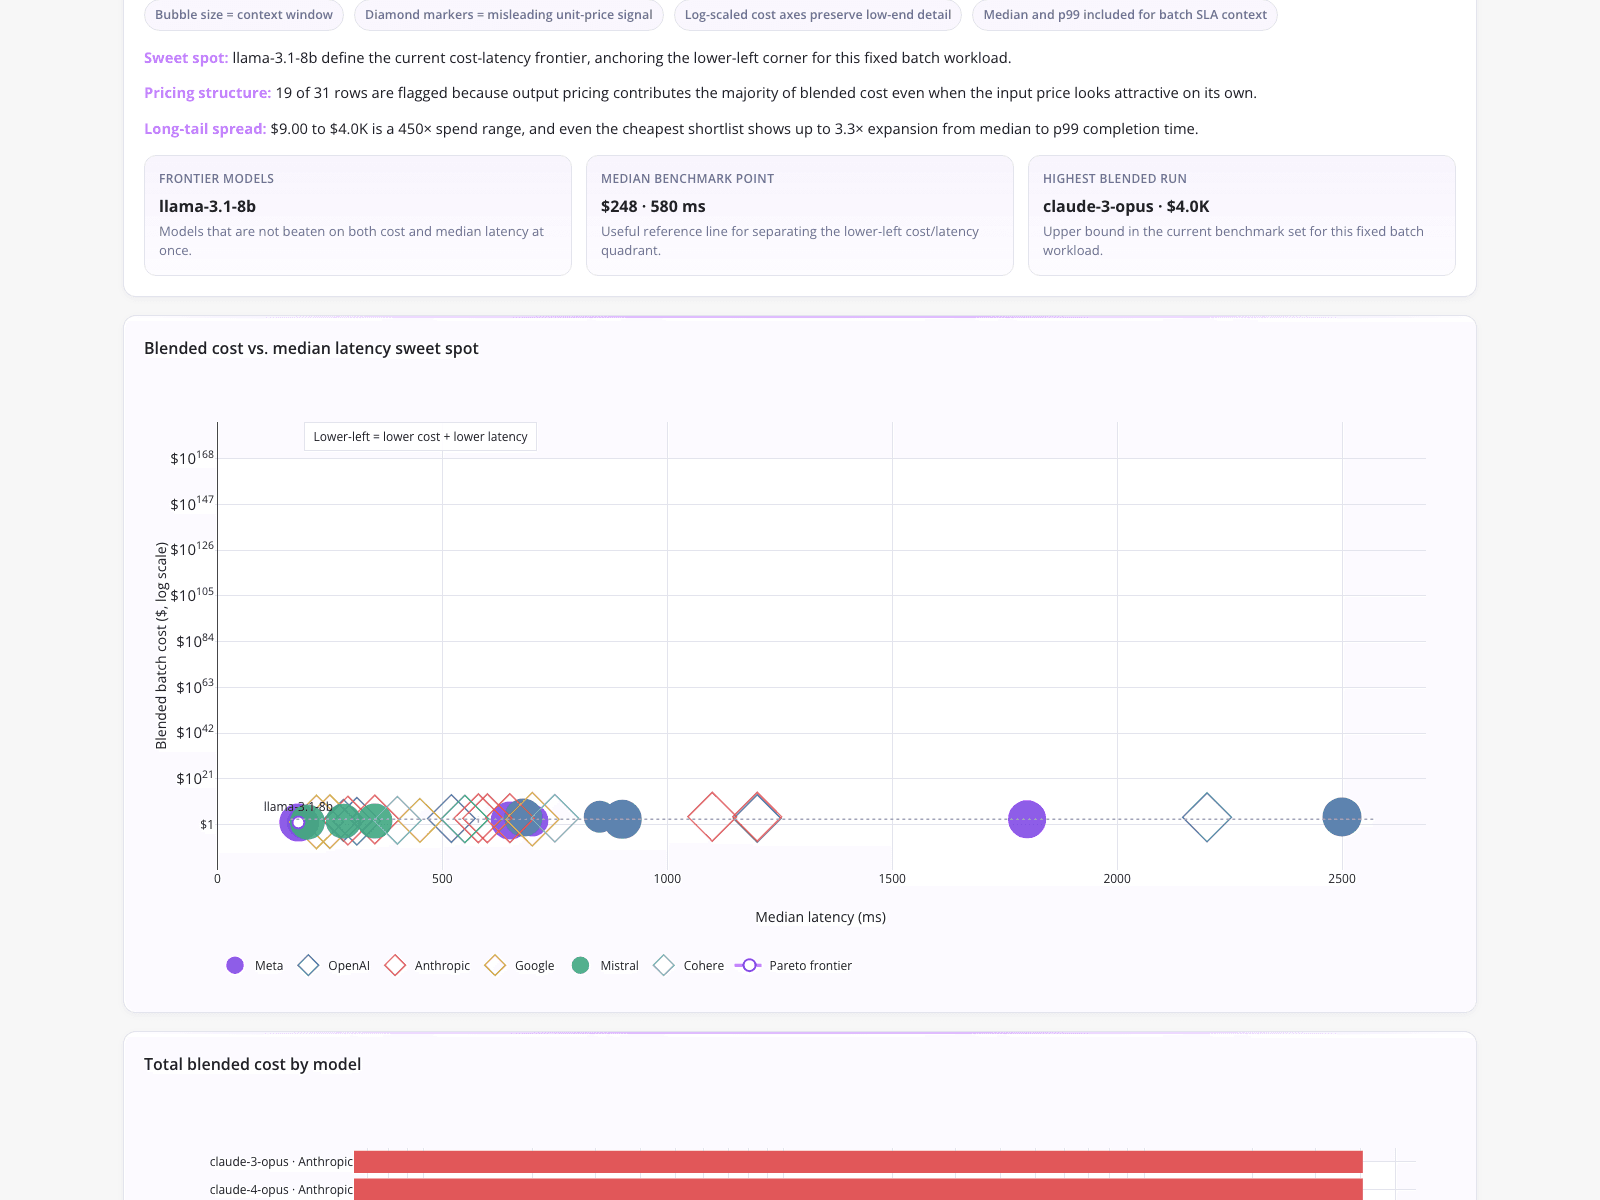
This dashboard demonstrates how a machine learning lead evaluated 31 models across six providers for a 300,000-record bulk text-structuring workload to understand exactly what is llm inference costing their team. By mapping blended batch costs against median latency on a log-scaled scatter plot, the team identified llama-3.1-8b as the frontier model with a lowest blended cost of $9.00 and fastest median latency of 180 ms. The visualization explicitly flagged 19 models with misleading pricing signals, enabling the engineering team to secure procurement sign-off based on a defensible cost-latency tradeoff.
What it shows:
Visualizing blended batch costs against median latency reveals the true operational expense of deploying language models at scale.