1.Aligning Disparate SEC Filing Data
Dashboard Analysis · 2026
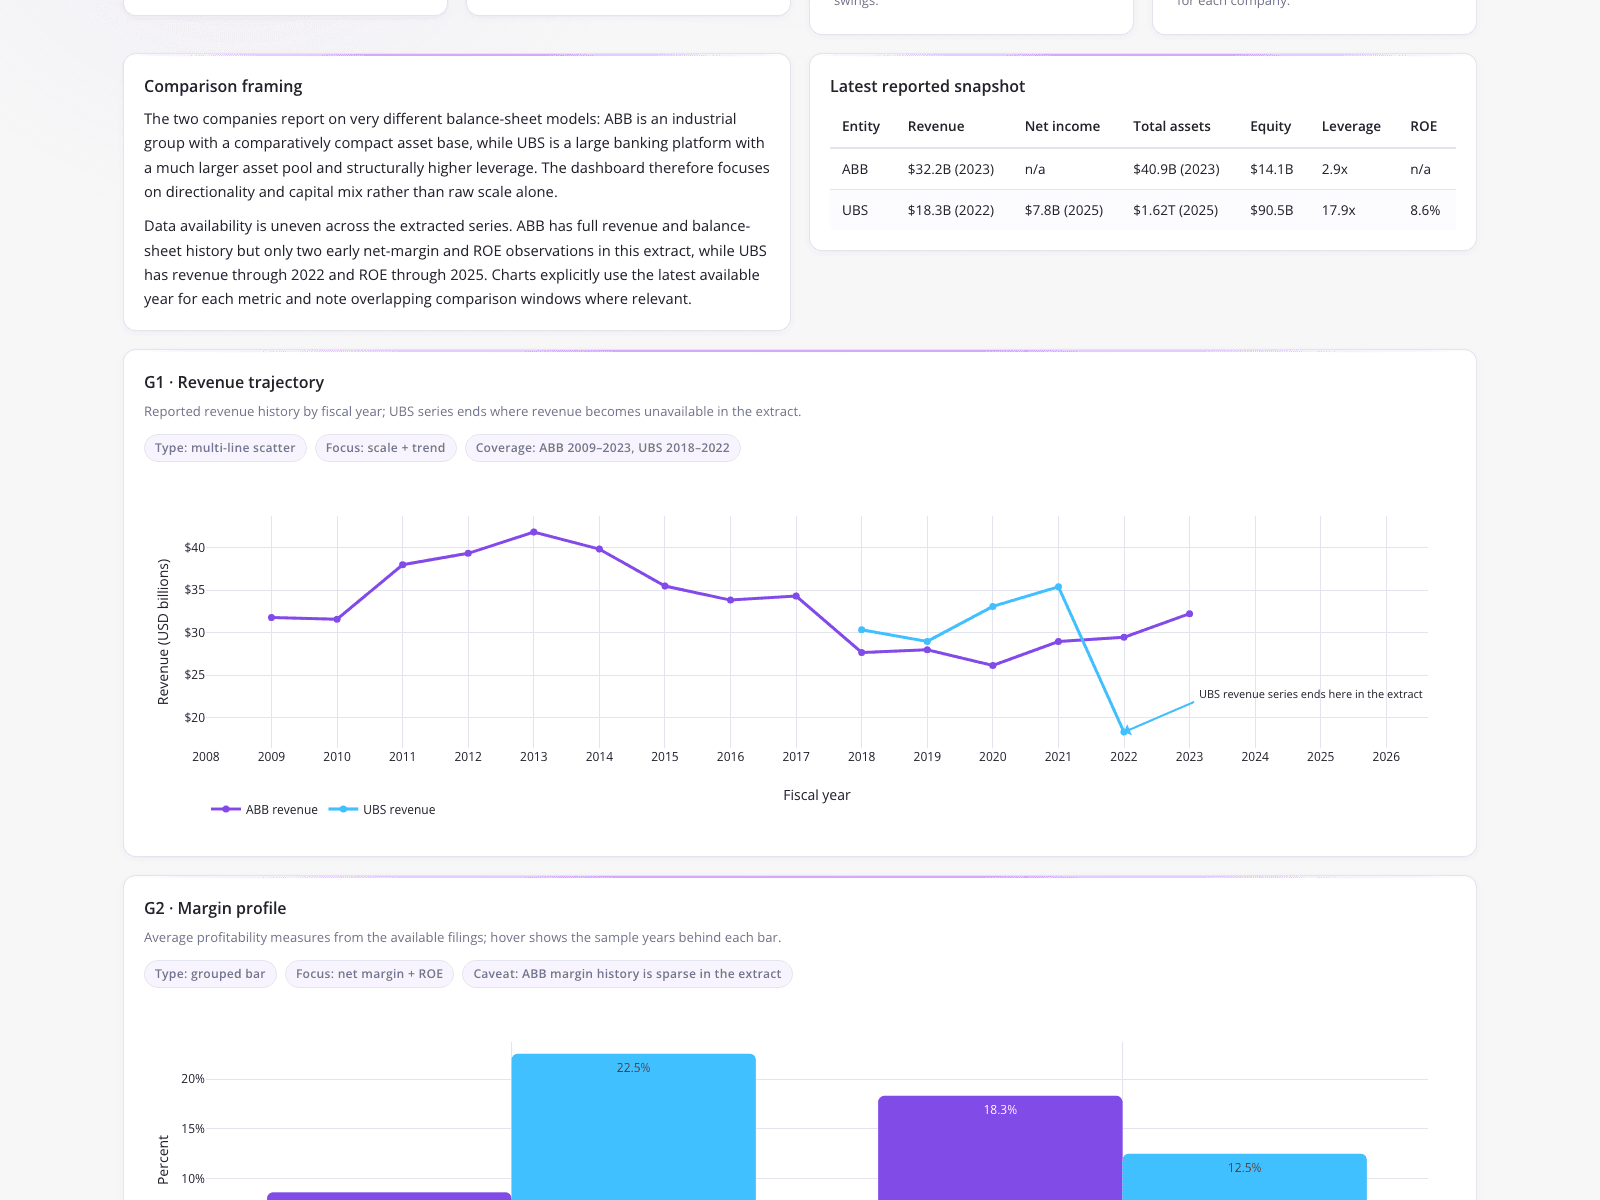
A fundamental equity analyst generated a dashboard to compare financial metrics for two Swiss large-cap equities, ABB and UBS, directly from SEC JSON filings. The dashboard lists $32.2B Revenue (2023) and $40.9B Total assets (2023) for ABB, alongside $18.3B Revenue (2022) and $1.62T Total assets (2025) for UBS. By successfully aligning this disparate data into a multi-line scatter chart, the analyst avoids scenarios where a model might underfit the financial realities due to uneven data availability or suffer from information leakage across reporting periods.
What it shows:
How to extract and align SEC data for portfolio review.
#sec-filing-analysis#financial-metrics-comparison#data-alignment-dashboard