1.Cross-Platform Efficiency Comparison for Ad Spend
combo-chart-heatmap · 2026
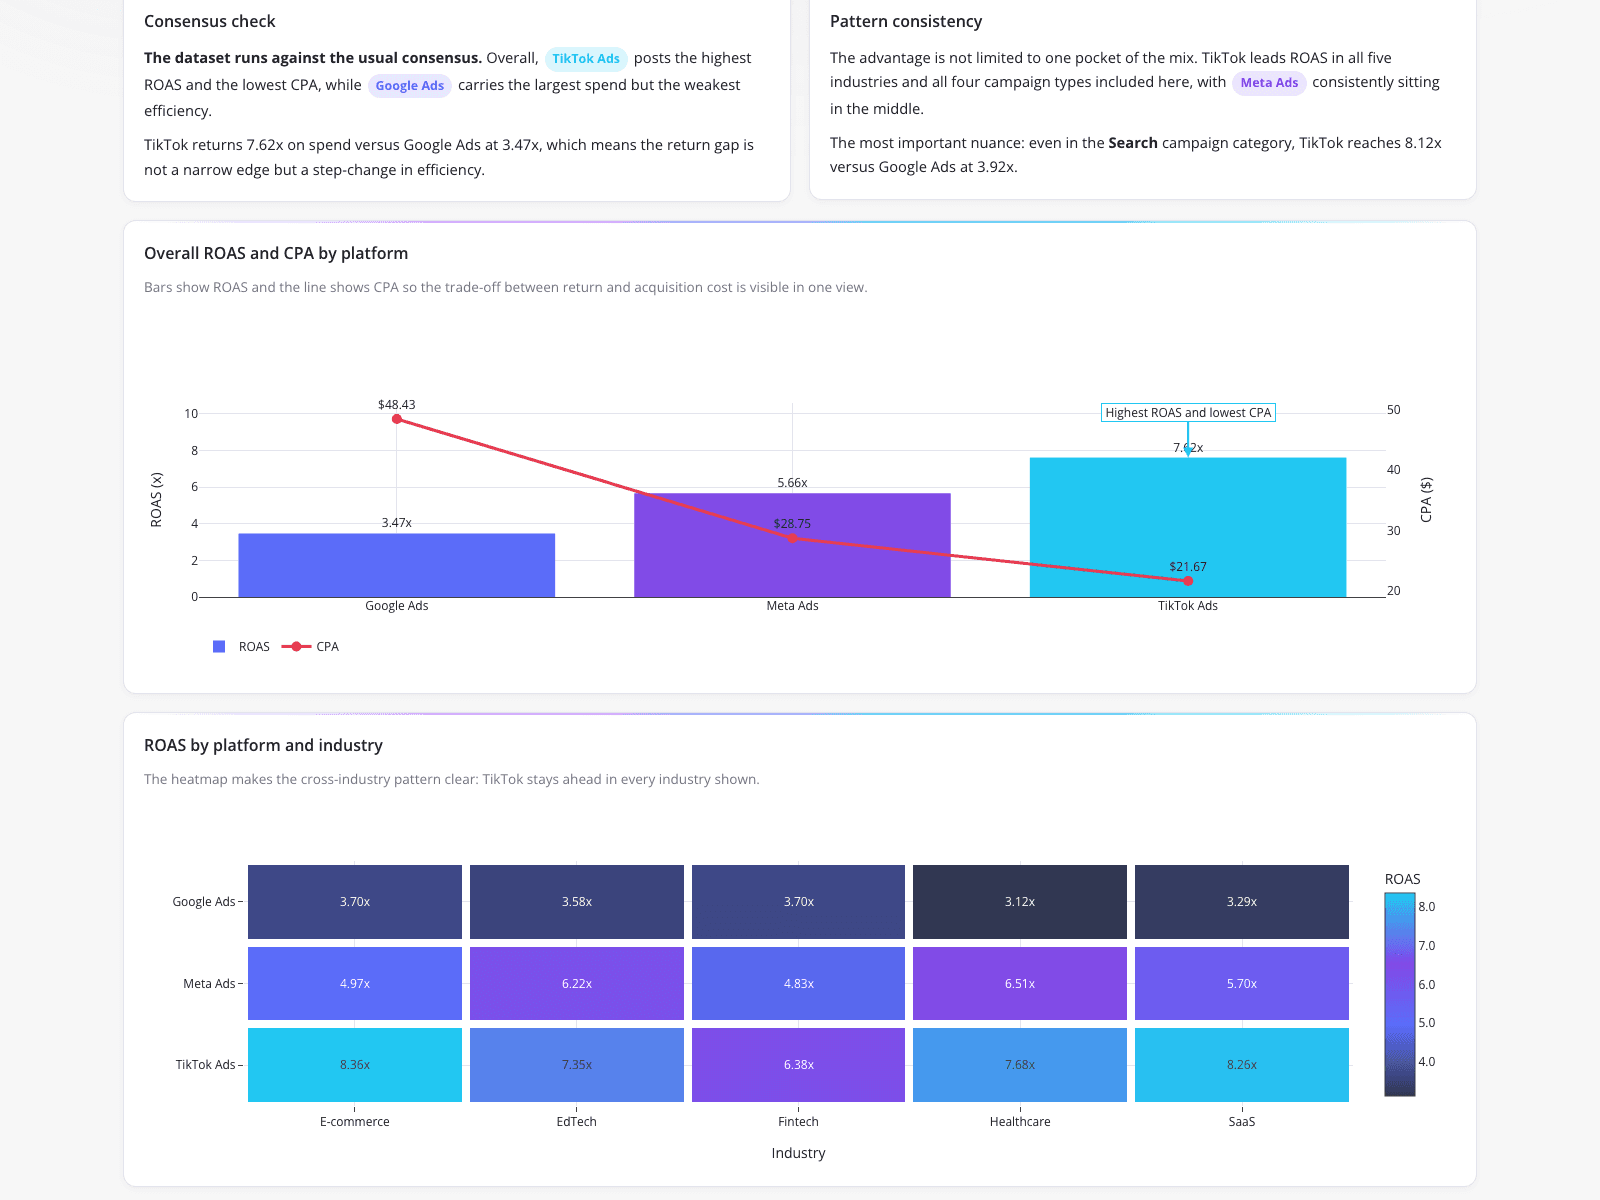
A performance marketing analyst used a combo-chart and heatmap dashboard to challenge assumptions about lower-funnel acquisition across different client verticals. The visualization overlays ROAS and CPA, showing TikTok Ads delivering a 7.62x ROAS at a $21.67 CPA, compared to Google Ads at a 3.47x ROAS and $48.43 CPA, while a heatmap confirms TikTok's dominance with peaks of 8.36x in E-commerce and 8.26x in SaaS. This demonstrates how effective ml orchestration can process multi-channel marketing data to justify quarterly budget reallocation.
What it shows:
How to visualize cross-platform efficiency to optimize ad spend.
#marketing-analytics#roas-analysis#cross-channel-reporting