1.Social Media Budget Allocation
Combo and Bubble · 2026
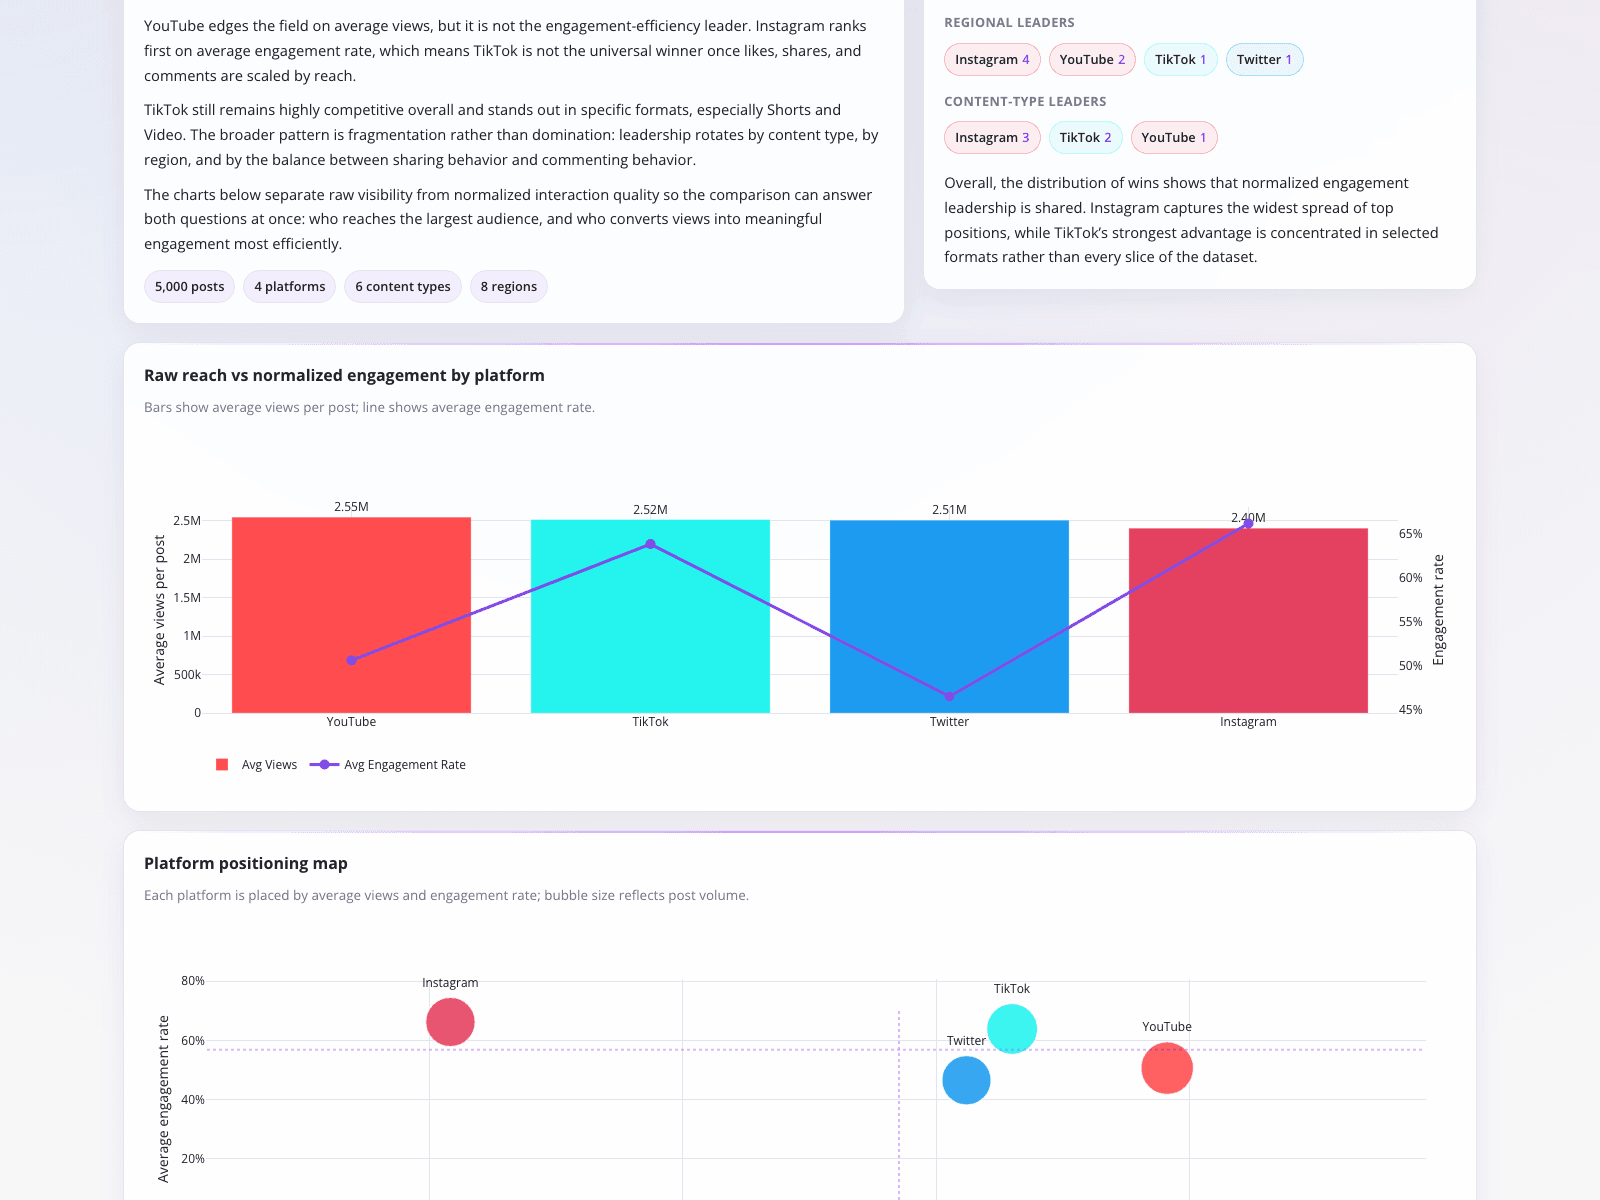
A social media analyst needed to allocate budget across YouTube, TikTok, Twitter, and Instagram, which appeared identical in raw reach. To solve this, they contrasted raw views with normalized engagement across 5,000 posts in 8 regions. A combo chart revealed that while average views hovered around 2.5M per post, engagement rates diverged sharply. TikTok and Instagram peaked near 65%, while Twitter dropped below 50%. A bubble chart further mapped positioning by engagement rate and post volume. Visualizing these hidden differences allowed the analyst to recommend budget shifts based on actual interaction efficiency rather than misleading view counts.
What it shows:
Contrast raw volume with normalized engagement rates to allocate budgets based on actual interaction efficiency.