1.Pharmacovigilance and Adverse Event Reporting
KPI Dashboard & Heatmap · 2026
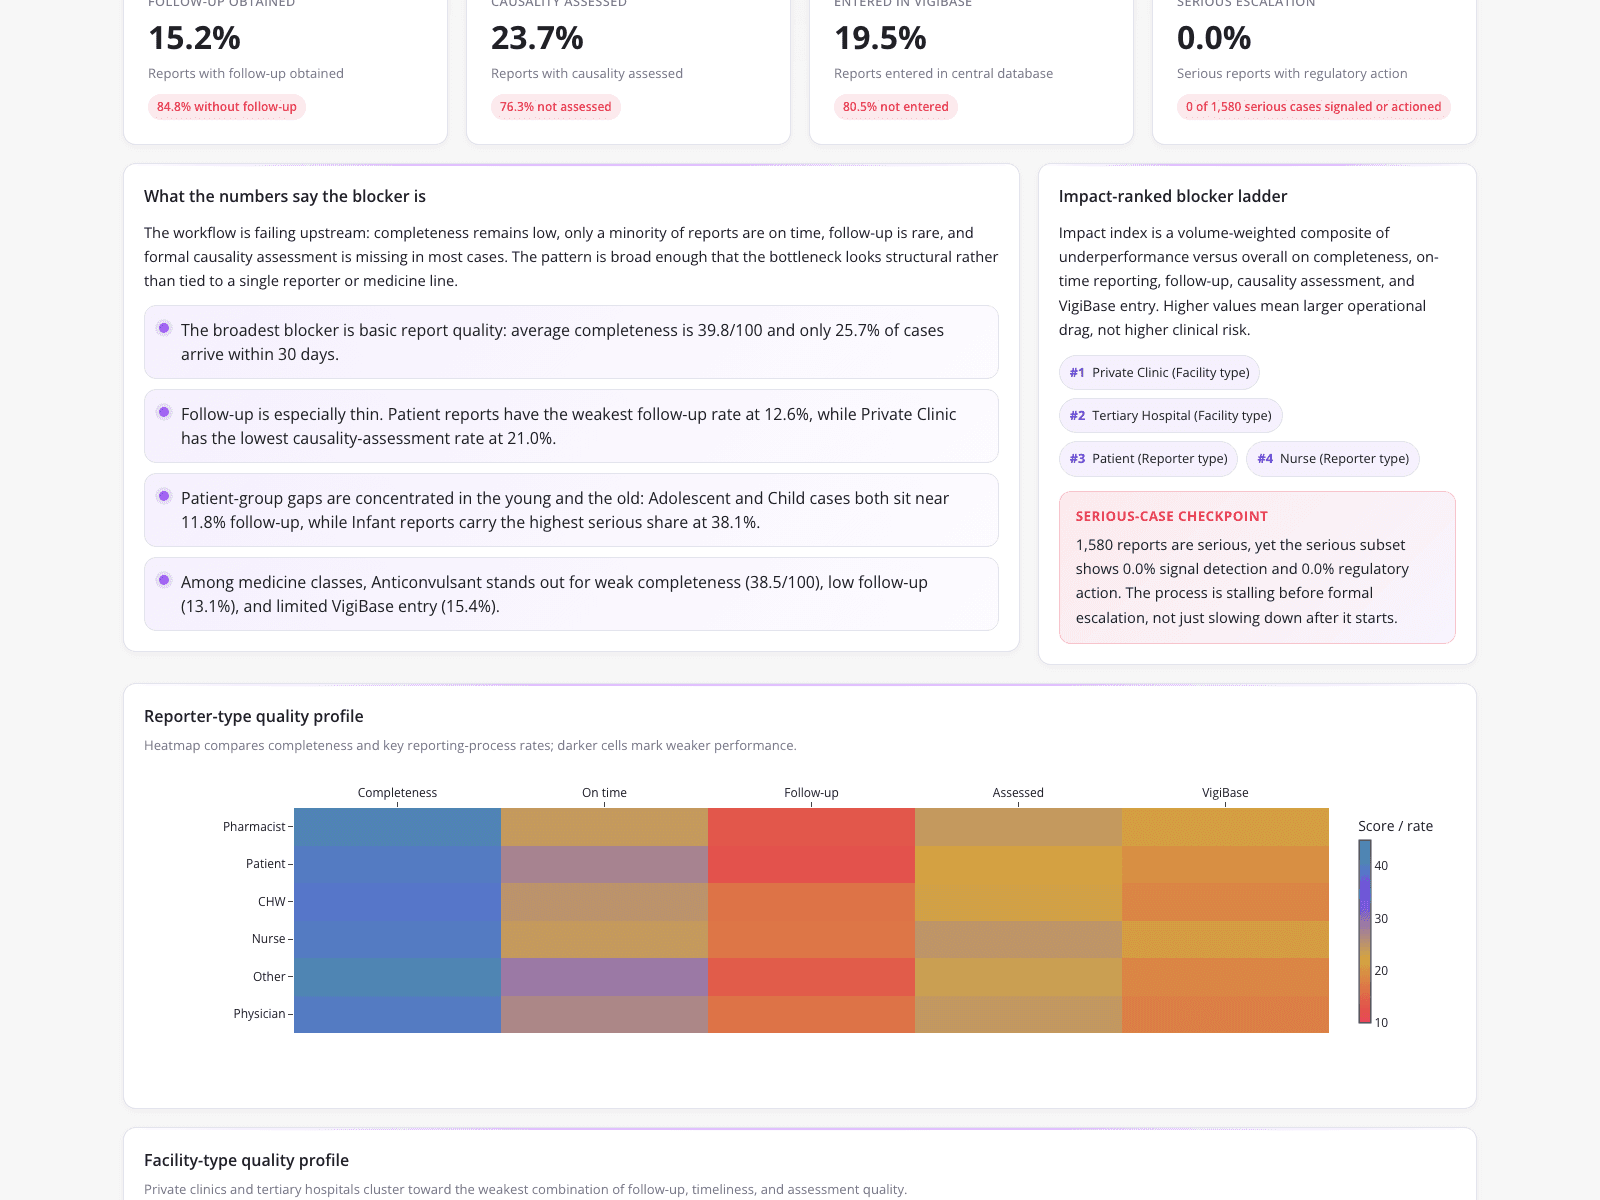
This dashboard analyzes adverse event reporting quality for a pharmacovigilance team. Top KPI cards reveal critical process failures, including a 15.2% follow-up rate and a 0.0% regulatory action rate across 1,580 serious cases. A text panel identifies bottlenecks, showing an average completeness score of 39.8/100 and noting that only 25.7% of cases arrive within 30 days. An impact-ranked blocker ladder pinpoints private clinics and tertiary hospitals as top operational drags. Finally, a reporter-type heatmap visually compares completeness and follow-up rates across pharmacists, patients, and nurses, exposing weak patient follow-up rates of 12.6%.
What it shows:
Visualizing compliance metrics and operational blockers helps teams identify exactly where serious-case reporting stalls.