1.Financial Model Boundary Error Resolution
Financial Model Validation · 2026
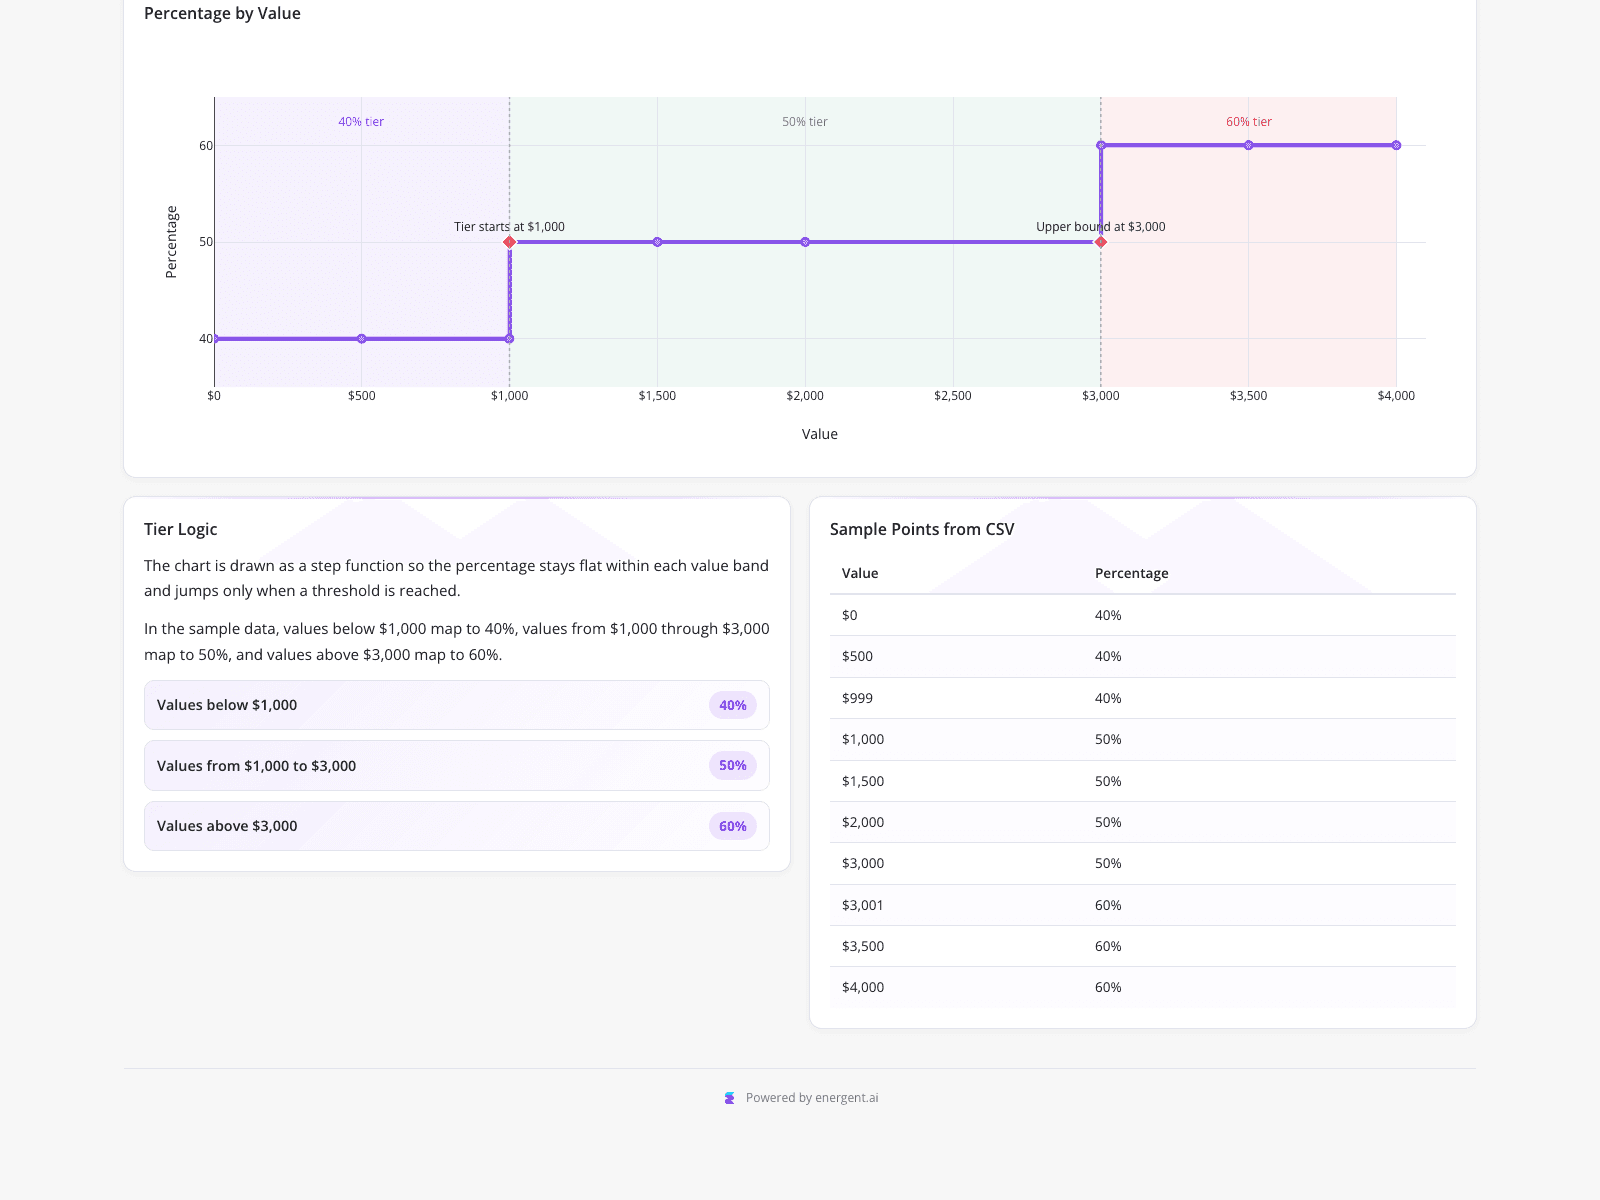
This dashboard visualizes a three-tier commission structure designed to resolve a boundary error in a financial model. The primary step chart maps revenue values from $0 to $4,000 against commission percentages ranging from 40% to 60%, using color-coded bands and red diamond markers to highlight critical boundary points at exactly $1,000 and $3,000. By detailing specific test values like $999 and $1,000 in a supplementary table, this visualization helped a financial modeler verify that the boundary gaps causing silent errors in their template were completely eliminated.
What it shows:
Validates boundary logic to prevent silent errors in tiered commission models.
#commission-structure#boundary-error#financial-modeling