1.Untangling Collinear Behavioral Variables in Education
Scatter plot · 2026
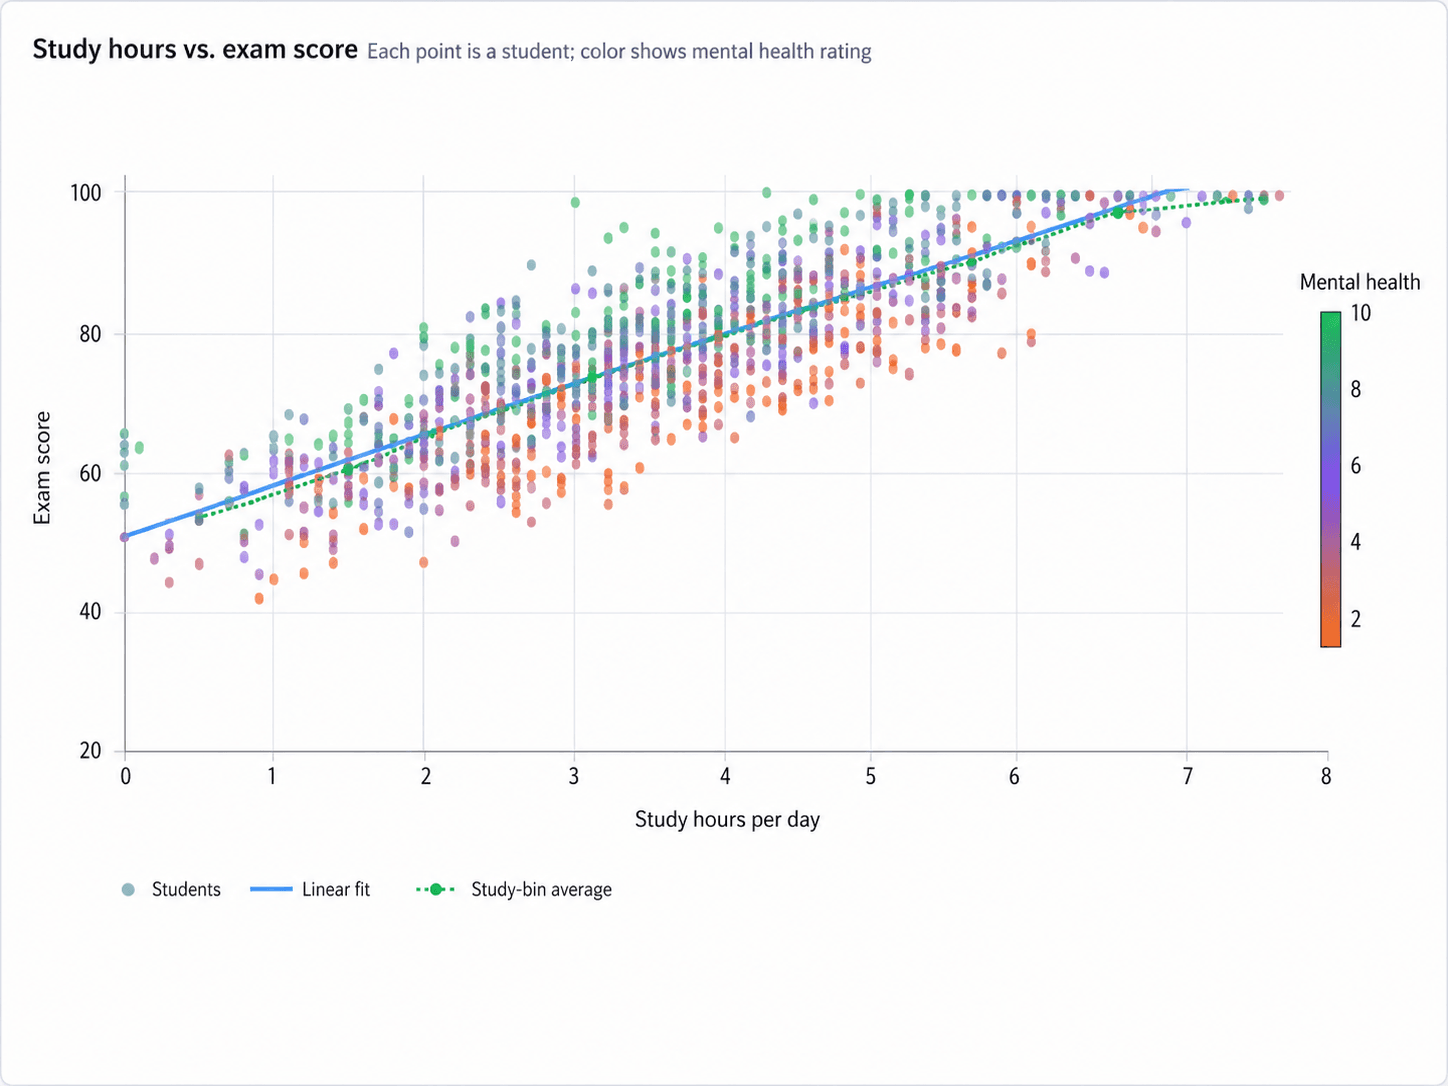
An education research analyst needed to untangle collinear behavioral variables to understand their independent impacts on student exam performance. Using a scatter plot, they visualized the relationship between study hours per day (scaled 0 to 8) and exam scores (scaled 20 to 100). A solid blue linear fit line showed a strong positive correlation, rising from a score of roughly 50 at zero hours to near 100 at seven hours. To address collinearity, a mental health rating was mapped to a color scale (orange at 2 to green at 10). Green points clustered above the trendline, while orange and purple fell below. This visual inspection prepared the analyst for controlled multiple regression models.
What it shows:
Visualizing overlapping variables helps analysts inspect collinearity before running controlled regression models.