1.Multi-Year Cash Flow Dynamics Analysis
text summary and stacked bar chart · 2026
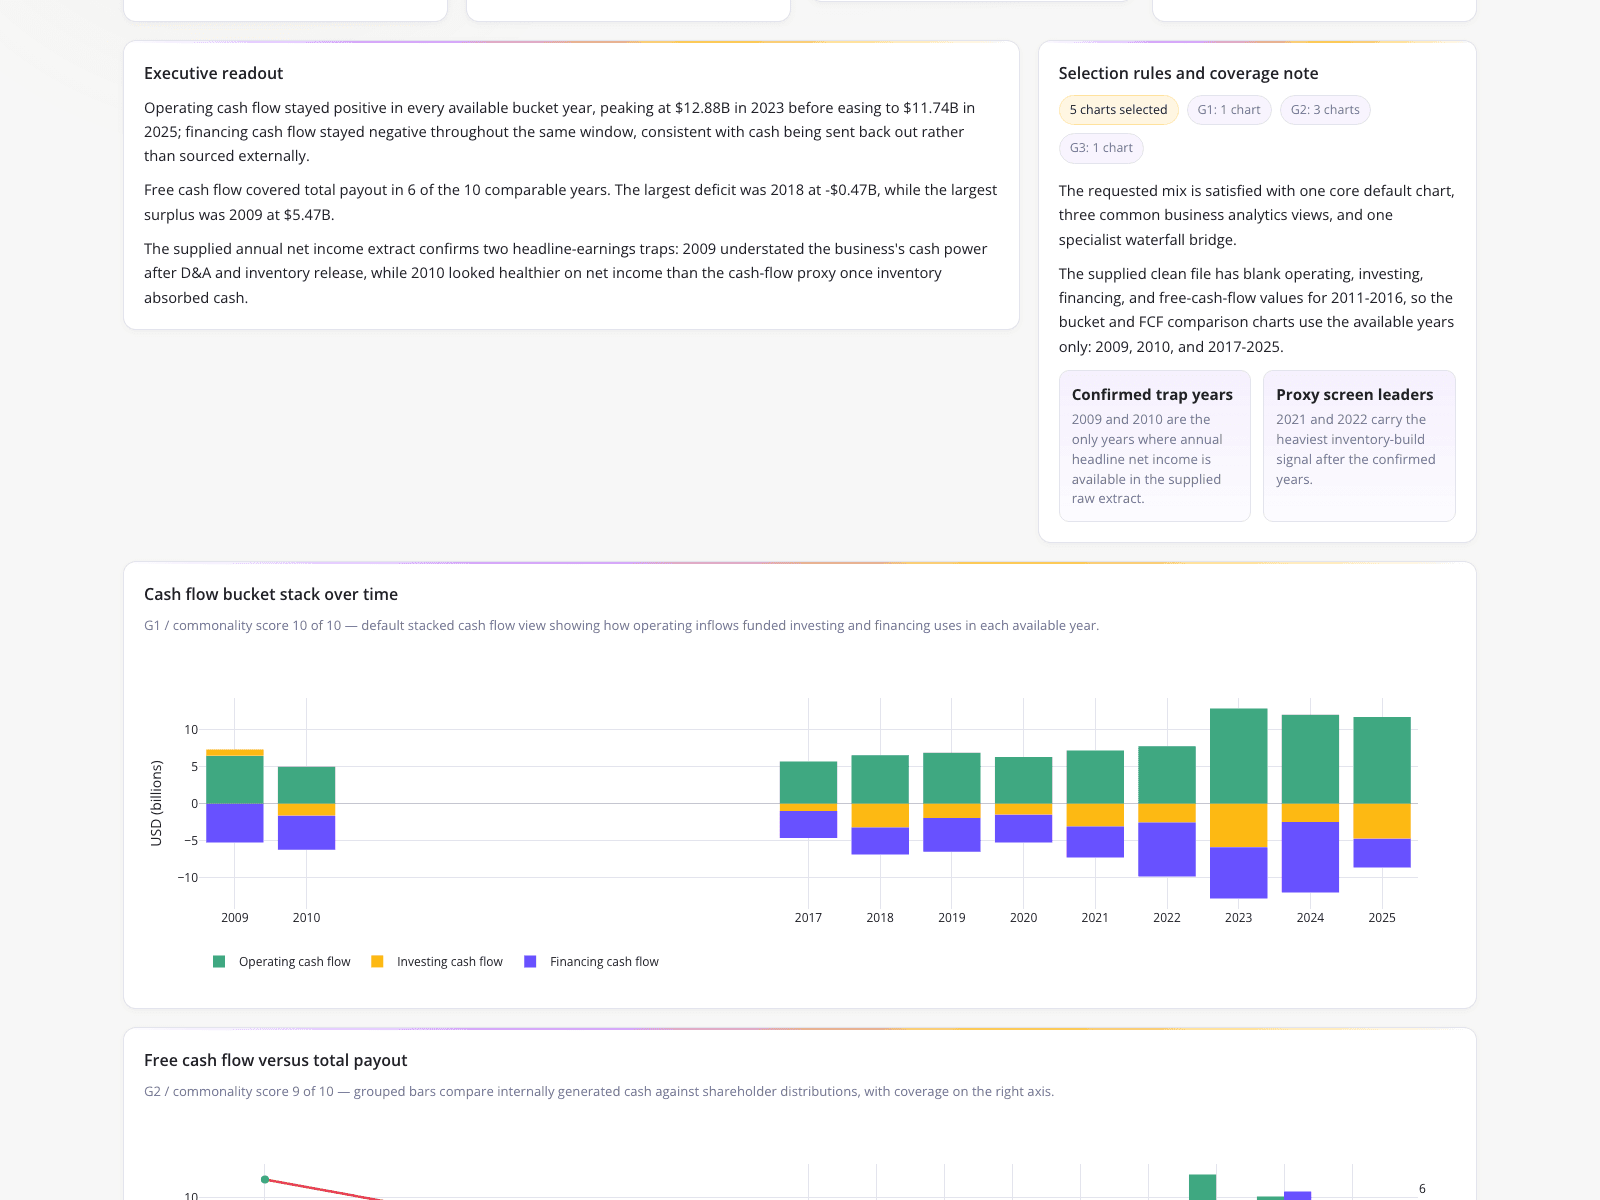
A dashboard analyzes a company's cash flow dynamics across a multi-year cycle. The executive readout notes that operating cash flow peaked at $12.88B in 2023 before easing to $11.74B in 2025, and highlights that free cash flow covered total payouts in 6 of 10 comparable years. The largest surplus occurred in 2009 ($5.47B) and the largest deficit in 2018 (-$0.47B). A selection rules panel explains data gaps for 2011-2016, restricting the stacked bar charts to 2009, 2010, and 2017-2025, which enables a financial analyst to visualize long-term capital allocation trends despite incomplete historical net income data.
What it shows:
How to visualize long-term capital allocation trends despite incomplete historical data.