1.Inventory Performance and Target Benchmarking
Dashboard · 2026
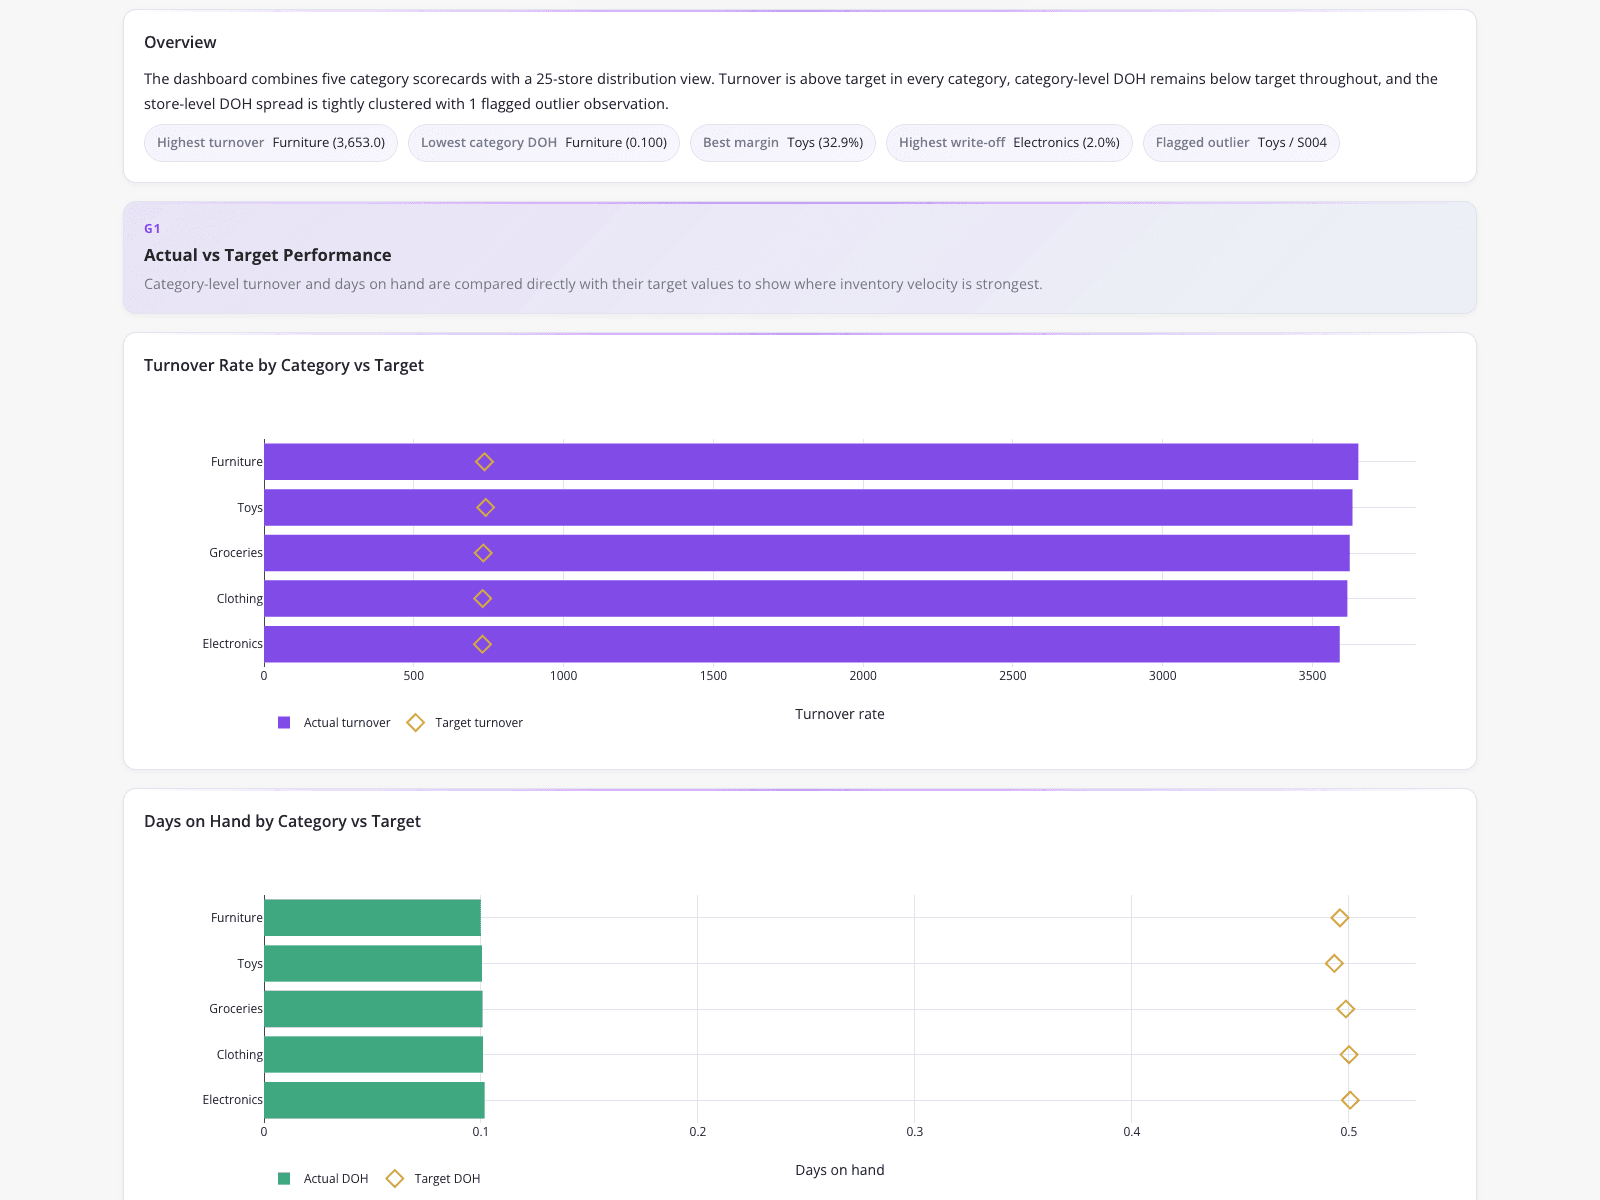
A Retail Supply Chain Analyst built this dashboard to track key inventory metrics against empirical benchmarks across five product categories: Furniture, Toys, Groceries, Clothing, and Electronics. The overview highlights critical extremes, such as the highest turnover in Furniture (3,653.0) and the best margin in Toys (32.9%). Two horizontal bar charts compare actual metrics against target benchmarks. The turnover rate chart shows actuals vastly exceeding targets (near 3,600 vs. 750), while the Days on Hand chart displays actuals at 0.1, well below the 0.5 target. This application of operations analytics solved the problem of lacking category-level benchmarks, enabling teams to make informed procurement decisions.
What it shows:
Visualizing actual performance against specific category targets instantly highlights where inventory velocity is strongest.