1.Financial Metrics Comparison from SEC Filings
Financial Dashboard · 2026
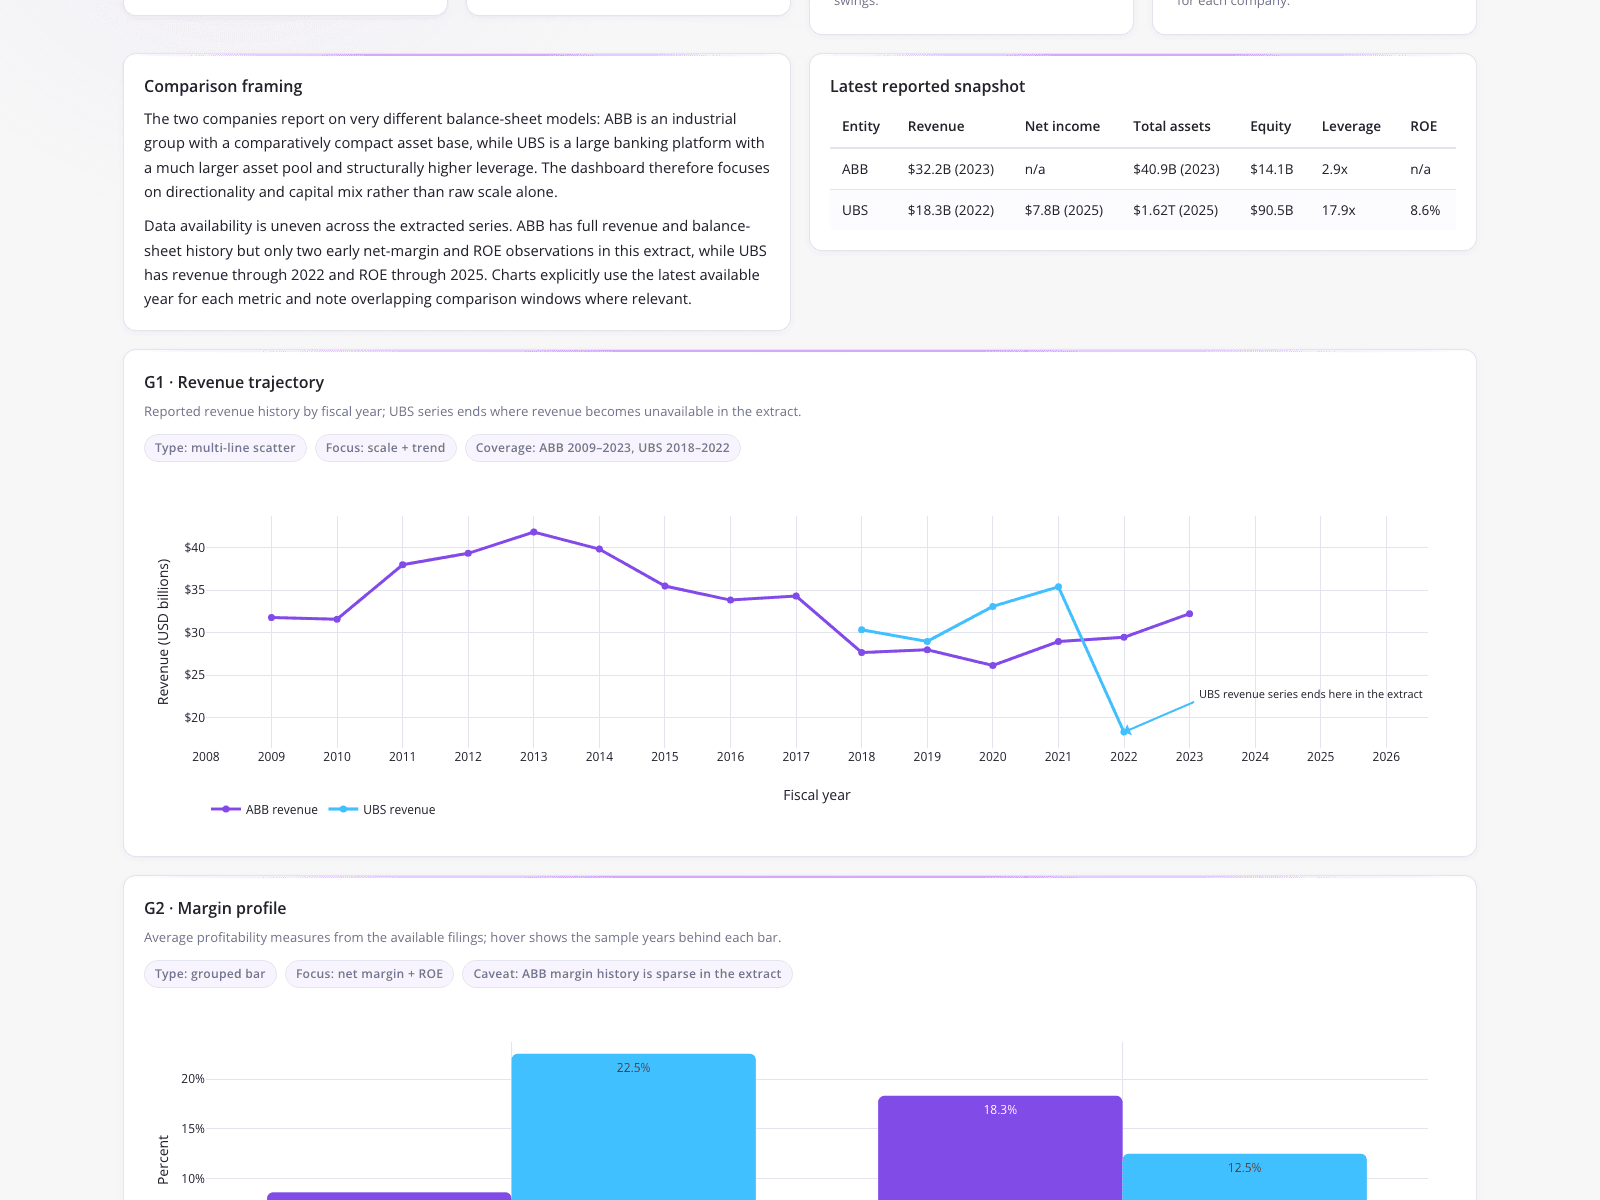
A fundamental equity analyst generated a dashboard to compare financial metrics for two Swiss large-cap equities, ABB and UBS, directly from SEC JSON filings. The dashboard includes a "Comparison framing" panel and a "Latest reported snapshot" table showing $32.2B Revenue (2023), $40.9B Total assets (2023), $14.1B Equity, and 2.9x Leverage for ABB. For UBS, it lists $18.3B Revenue (2022), $7.8B Net income (2025), $1.62T Total assets (2025), $90.5B Equity, 17.9x Leverage, and 8.6% ROE. A multi-line scatter chart plots Revenue against Fiscal year (2008-2026), showing ABB peaking around $42B in 2013 and UBS dipping to roughly $18B in 2022. A grouped bar chart displays margins of 22.5%, 18.3%, and 12.5%.
What it shows:
How to extract and align disparate financial data for portfolio review.