1.Automotive Fleet Efficiency Analysis
line chart and heatmap · 2026
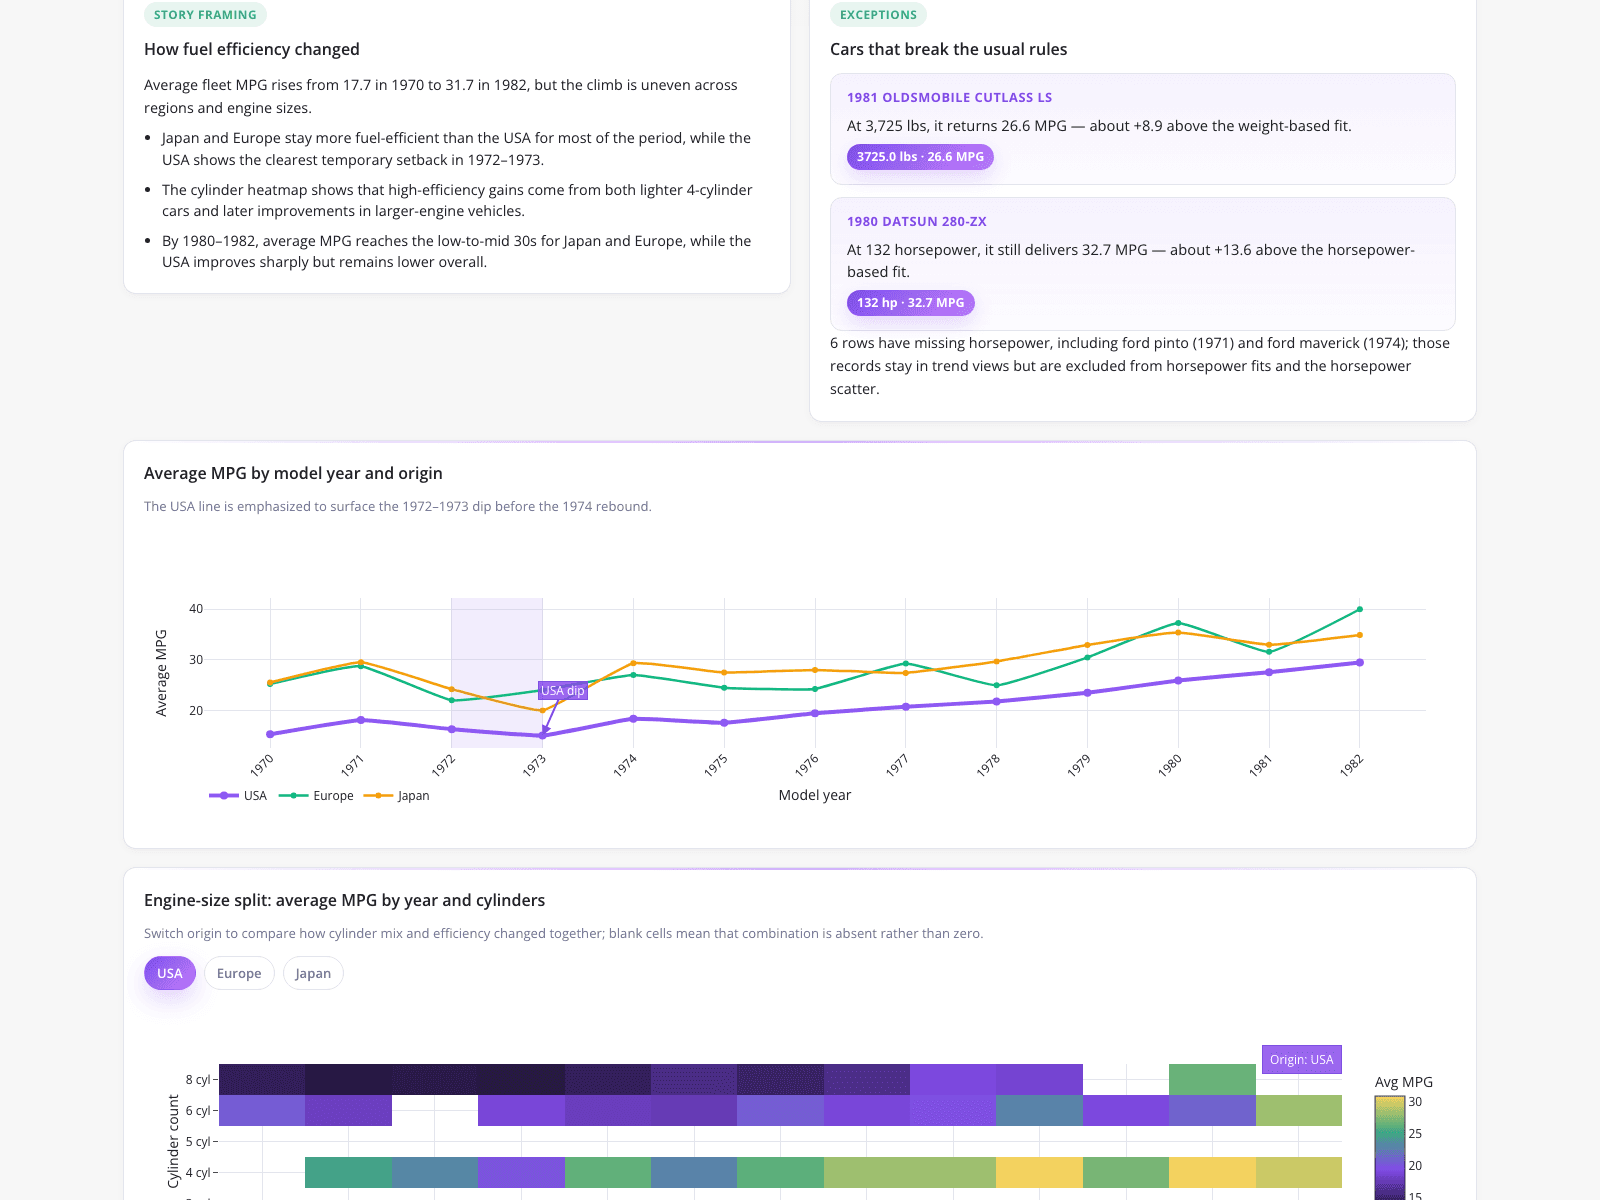
An automotive data analyst needed to visualize historical vehicle fuel economy trends from 1970 to 1982 to contextualize fleet efficiency trajectories. The automated dashboard solved the challenge of segmenting regional data and surfacing anomalies without manual spreadsheet manipulation. It features a multi-line chart tracking average MPG by model year and origin, highlighting a specific dip in the USA between 1972 and 1973. An exceptions panel isolates statistical outliers, such as a 1981 Oldsmobile Cutlass LS and a 1980 Datsun 280-ZX that beat regression fits. A heatmap further displays engine-size splits by year and cylinders.
What it shows:
Automated outlier detection isolates statistical anomalies without manual data manipulation.