1.Evaluating Predictive Features in Healthcare Analytics
Healthcare Analytics · 2026
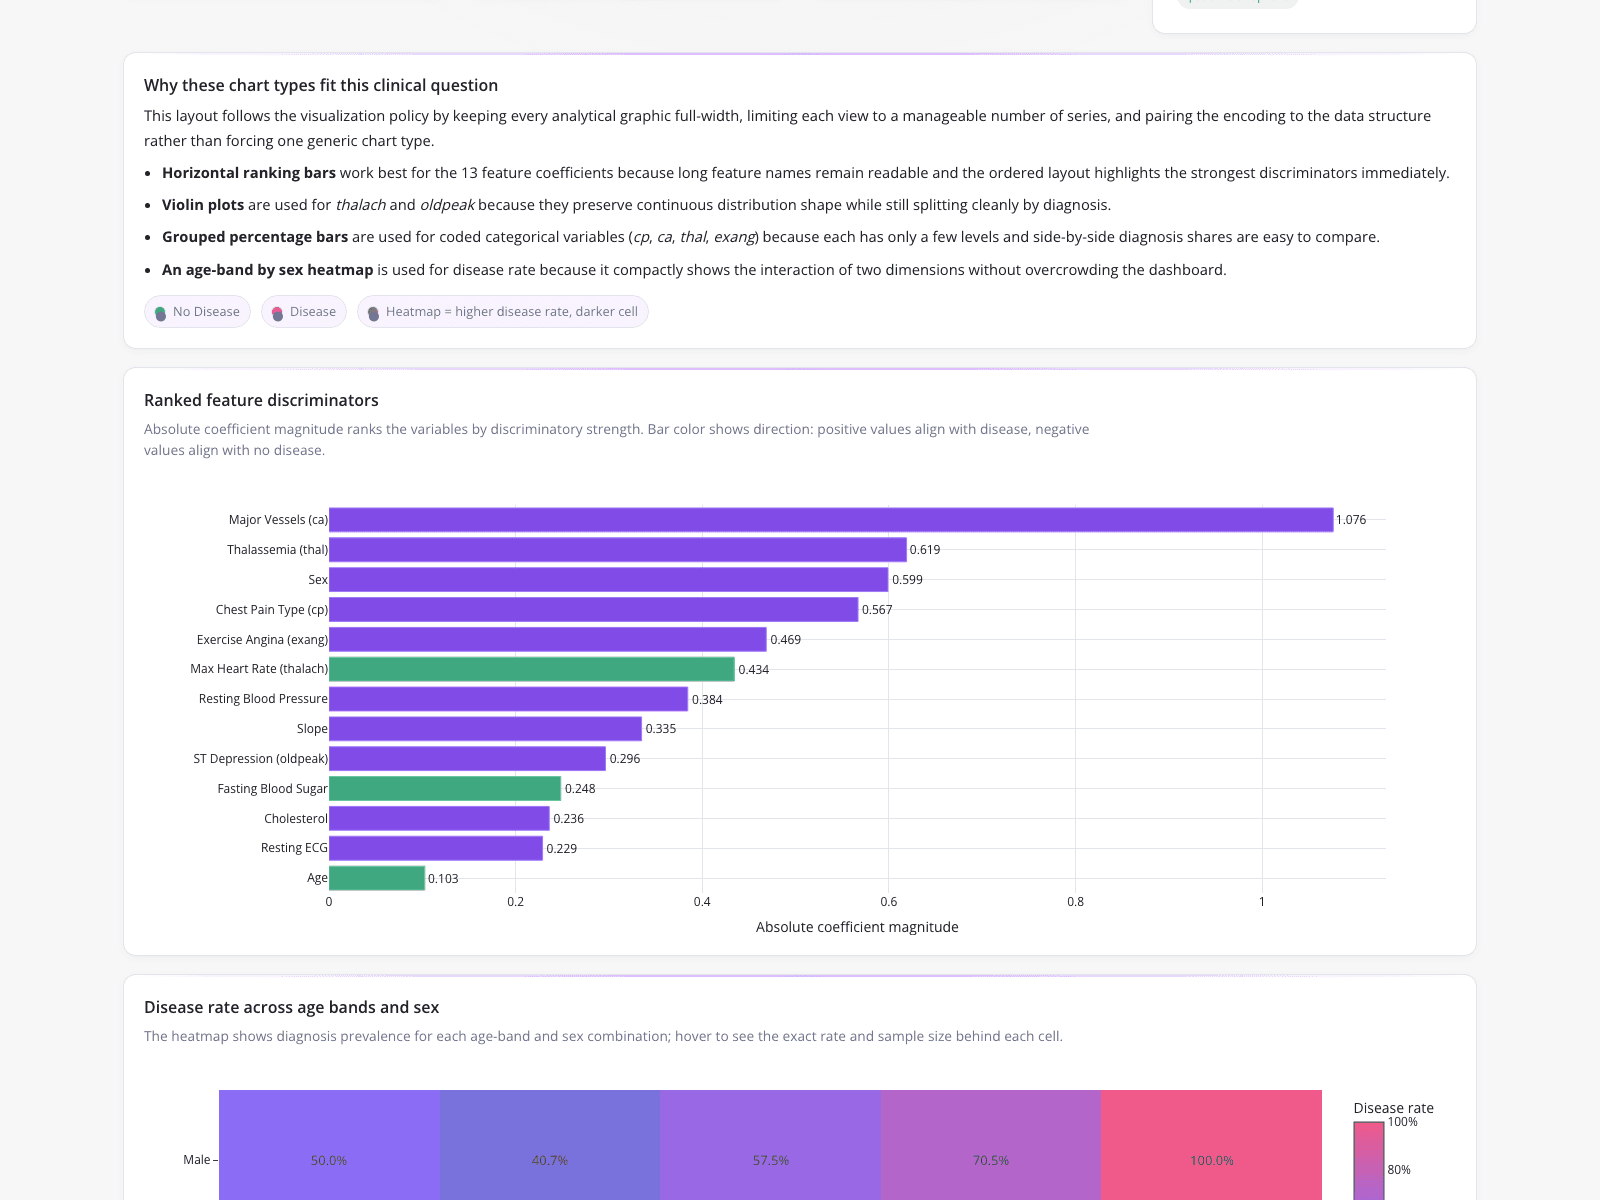
A clinical data analyst needed to identify true predictors of heart disease while controlling for demographic confounders. Moving beyond basic correlations, the analyst evaluated various data analysis models to isolate independent predictive power. The resulting dashboard features a horizontal bar chart ranking clinical variables by absolute coefficient magnitude, revealing 'Major Vessels' (1.076) and 'Thalassemia' (0.619) as top predictors, while conventional markers like 'Cholesterol' (0.236) ranked lower. A heatmap further visualizes male disease rates escalating from 40.7% to 100% across age bands. This visual evidence enabled a statistically defensible recommendation for updating triage protocols without relying on opaque spreadsheets.
What it shows:
Ranked feature discriminators and heatmaps provide clear visual evidence to challenge conventional assumptions.