1.Clinical Cohort Profiling Summary
Clinical cohort reporting · 2026
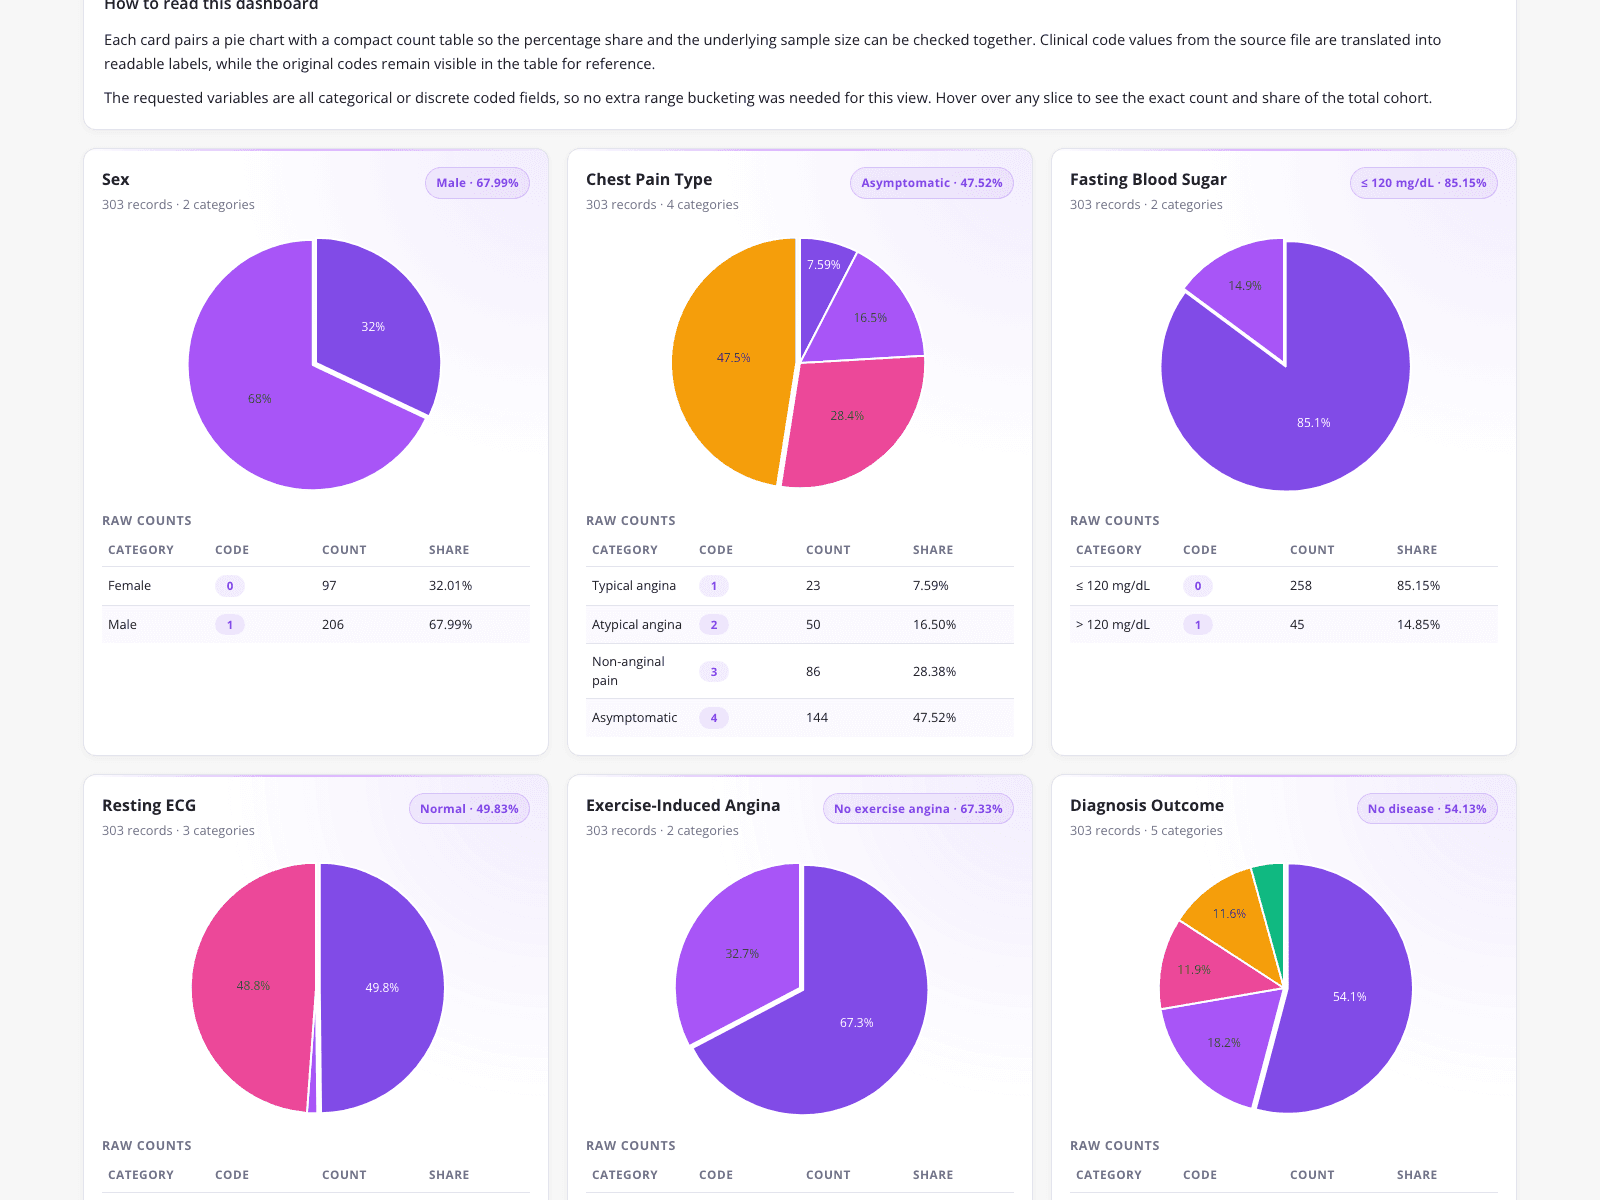
This dashboard provides a categorical profiling summary of a 303-patient heart disease cohort, built by a healthcare data analyst to replace manual spreadsheet analytics. The top KPI cards highlight key cohort characteristics, including a predominantly male population at 67.99 percent and an asymptomatic chest pain rate of 47.52 percent. By automatically mapping data dictionary codes to clinical labels and rendering the distributions side-by-side in pie charts and tables, this view eliminates the tedious process of manually building individual charts for stakeholder presentations.
What it shows:
Eliminates manual chart creation by mapping dictionary codes directly to clinical labels.
#clinical-analytics#cohort-profiling#healthcare-reporting