1.Financial Comparison and XBRL Extraction
Portfolio Analyst · 2026
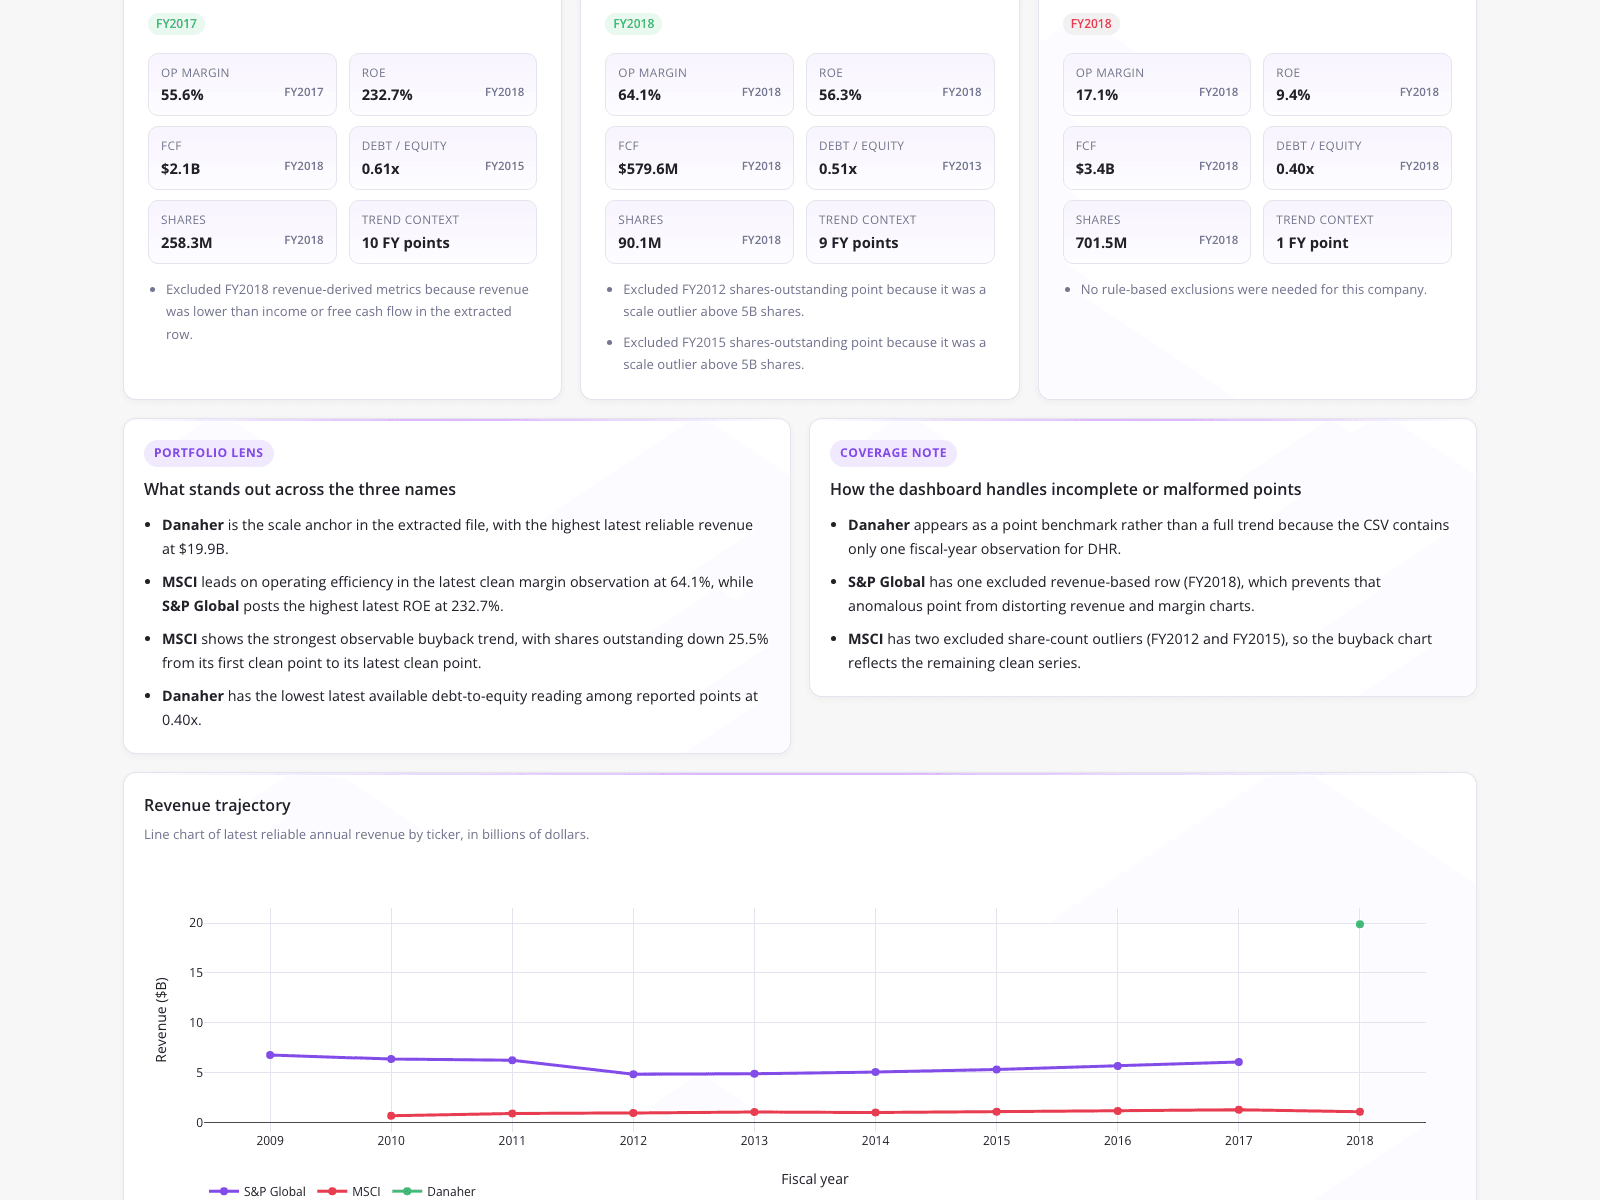
A portfolio analyst utilized this dashboard to evaluate a potential stock swap by extracting and visualizing raw XBRL data from SEC EDGAR filings without relying on expensive third-party terminals. The interface features metric cards displaying an OP Margin of 64.1% and ROE of 56.3% for MSCI in FY2018, alongside a revenue trajectory line chart tracking S&P Global, MSCI, and Danaher from 2009 to 2018. By integrating advanced data modeling tools, the analyst successfully overcame inconsistent tags and data anomalies to generate presentation-ready financial insights.
What it shows:
Automate the extraction of complex SEC EDGAR filings to instantly visualize revenue trajectories and operational margins.
#financial-comparison#sec-edgar-data#revenue-trajectory#xbrl-extraction#portfolio-analysis