1.Withdrawal Sustainability Modeling
Equity fund analysis · 2026
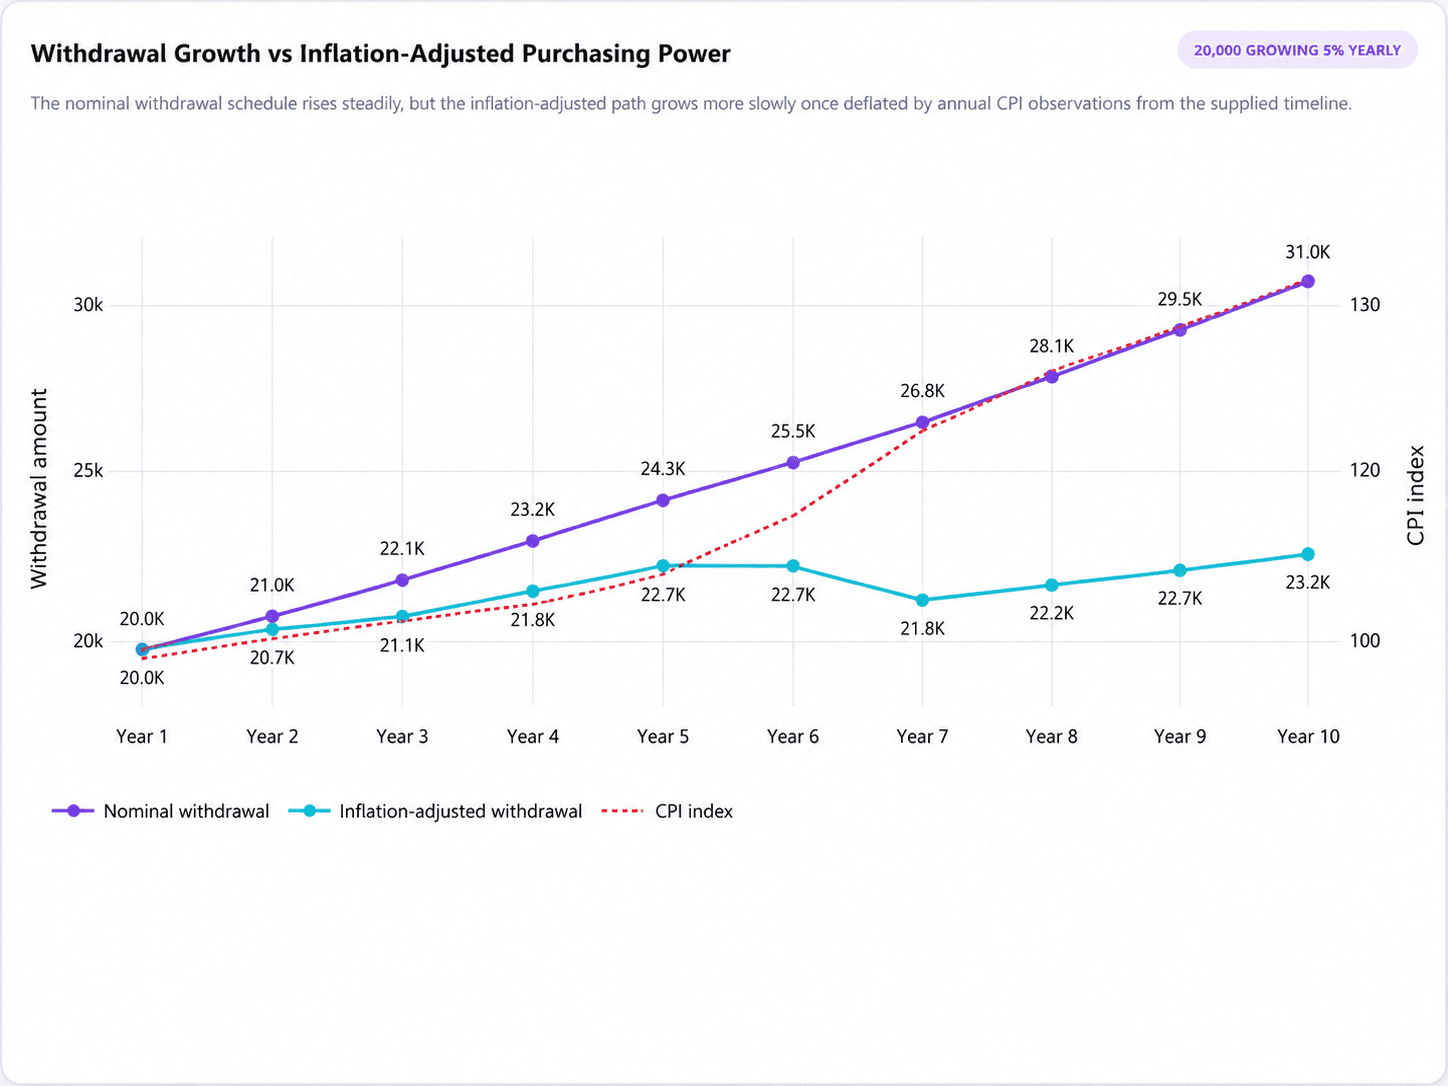
This dual-axis line chart, generated by an equity fund analyst, models withdrawal sustainability and inflation impacts over a comprehensive 10-year period. The visualization plots a nominal withdrawal starting at 20,000 and growing 5% annually against an inflation-adjusted withdrawal that peaks at 23,200, alongside a steadily rising CPI index tracked on the secondary y-axis. By mapping these three distinct trajectories, the analyst successfully demonstrated the real purchasing power of a specific withdrawal schedule to retirement and foundation clients, highlighting the deflationary impact of the CPI.
What it shows:
Demonstrates the real purchasing power of withdrawal schedules to clients.
#financial-investment#dual-axis-chart#inflation-modeling