1.Environmental Time-Series Analysis
Environmental Data Analyst · 2026
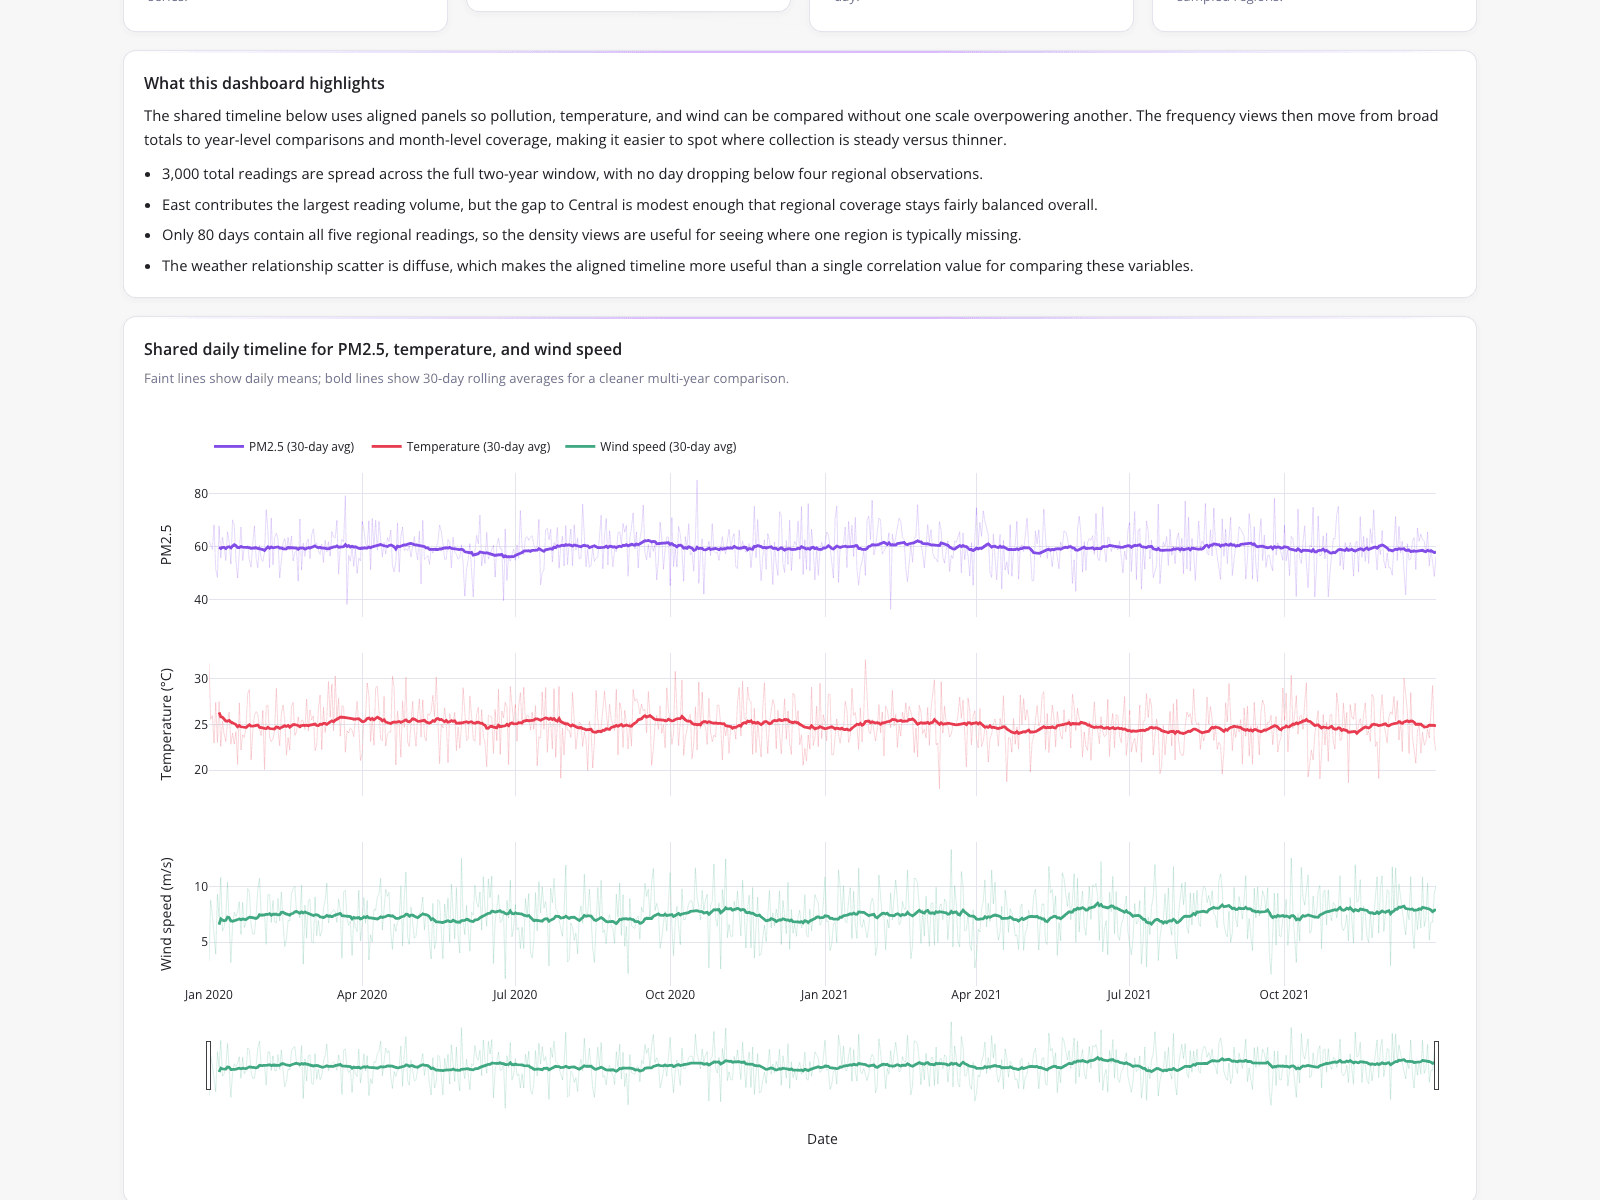
An Environmental Data Analyst utilized advanced statistical tools to track pollution trends by cleaning a daily dataset and nulling temperature outliers via the IQR method to preserve the time index. The resulting stacked time-series dashboard displays 3,000 readings across a two-year window, overlaying a 30-day rolling average on PM2.5, temperature, and wind speed to prevent scale distortion. Ultimately, the analyst found a diffuse weather relationship and a null correlation between pollution and weather variables, demonstrating how different types of statistics clarify complex environmental datasets.
What it shows:
Applying the IQR method preserves time indices while cleaning daily environmental datasets for accurate correlation testing.