1.CNC Vibration Anomaly Diagnostic Analysis
Diagnostic Analysis · 2026
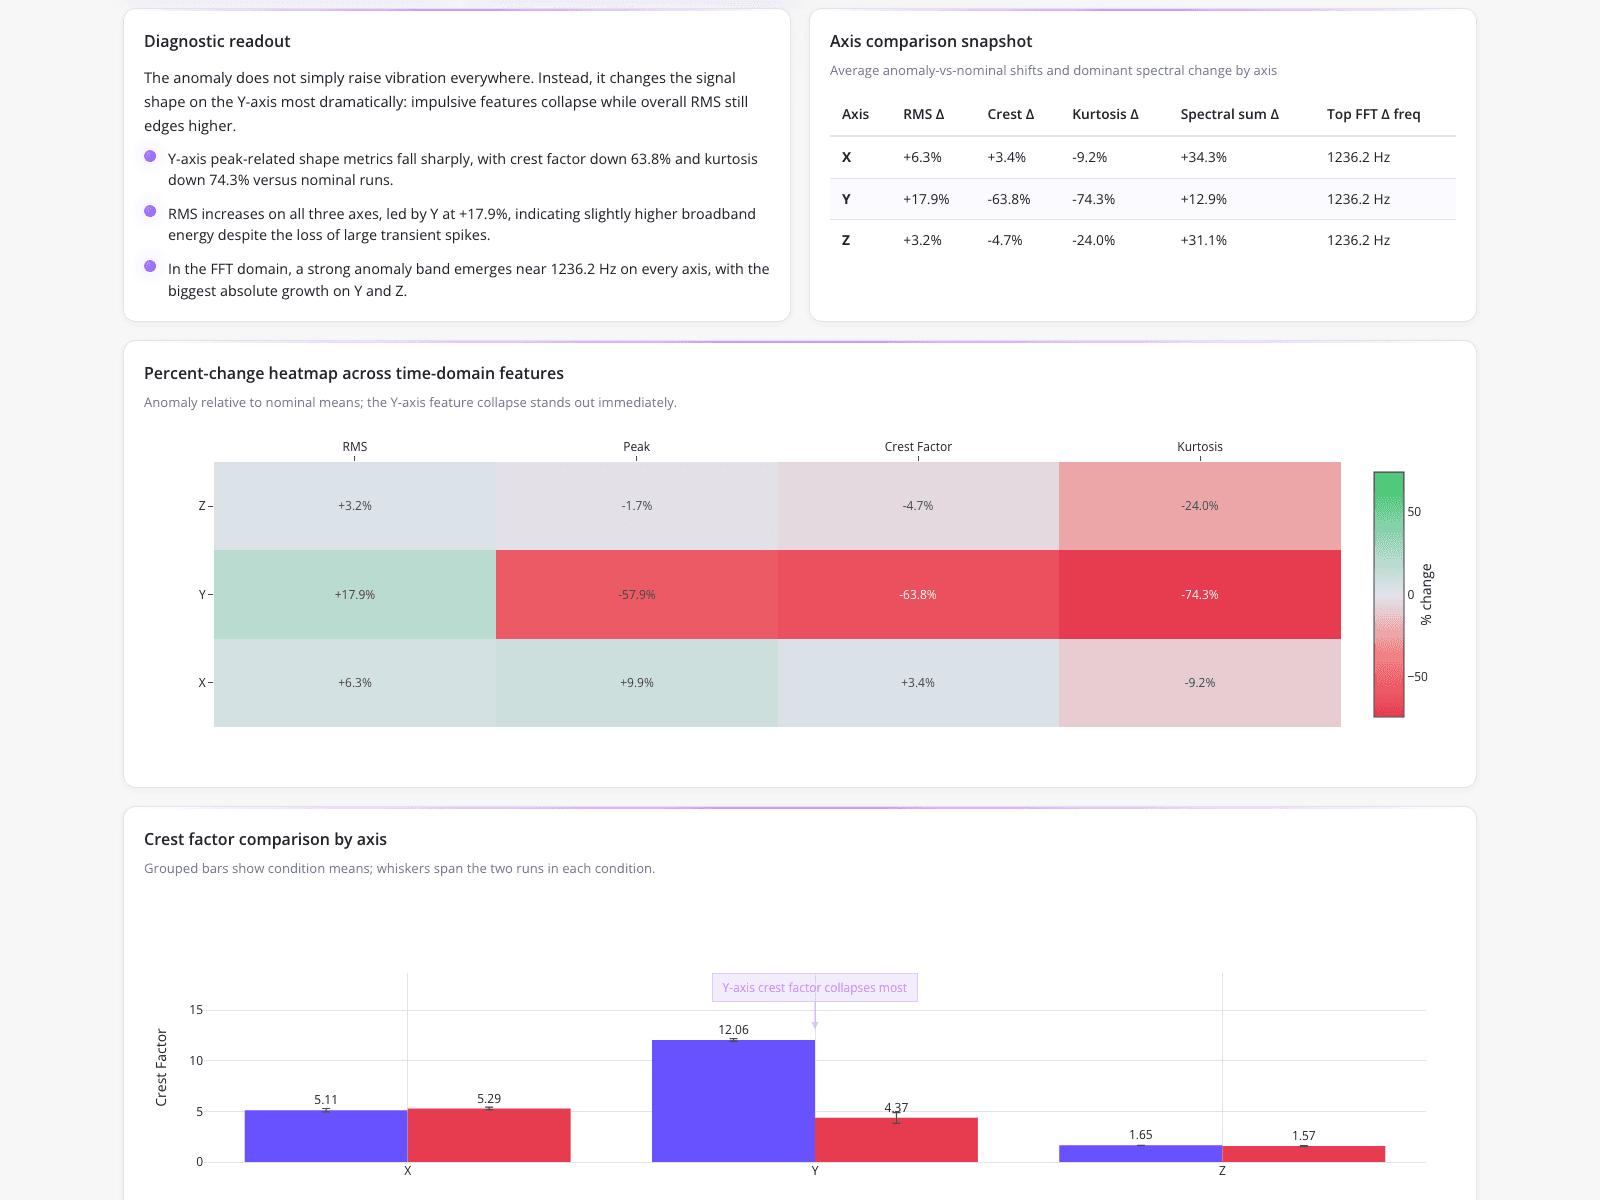
A CNC process engineer utilized a multi-view dashboard to diagnose a vibration anomaly that bypassed standard RMS-based machine alarms by comparing multi-axis time-domain and frequency-domain features. The dashboard's summary table and percent-change heatmap revealed that while Y-axis RMS increased slightly, the Y-axis crest factor and kurtosis plummeted by 63.8% and 74.3%, alongside a dominant spectral shift at 1236.2 Hz. By visualizing these specific feature collapses in a grouped bar chart, the engineer successfully pinpointed the structural vibration fault rather than relying on overall amplitude.
What it shows:
Visualizing specific feature collapses enables precise structural fault identification.
#cnc-machining#vibration-analysis#anomaly-detection