1.Macroeconomic Gravity Model Regression Diagnostics
Scatter plot and tables · 2026
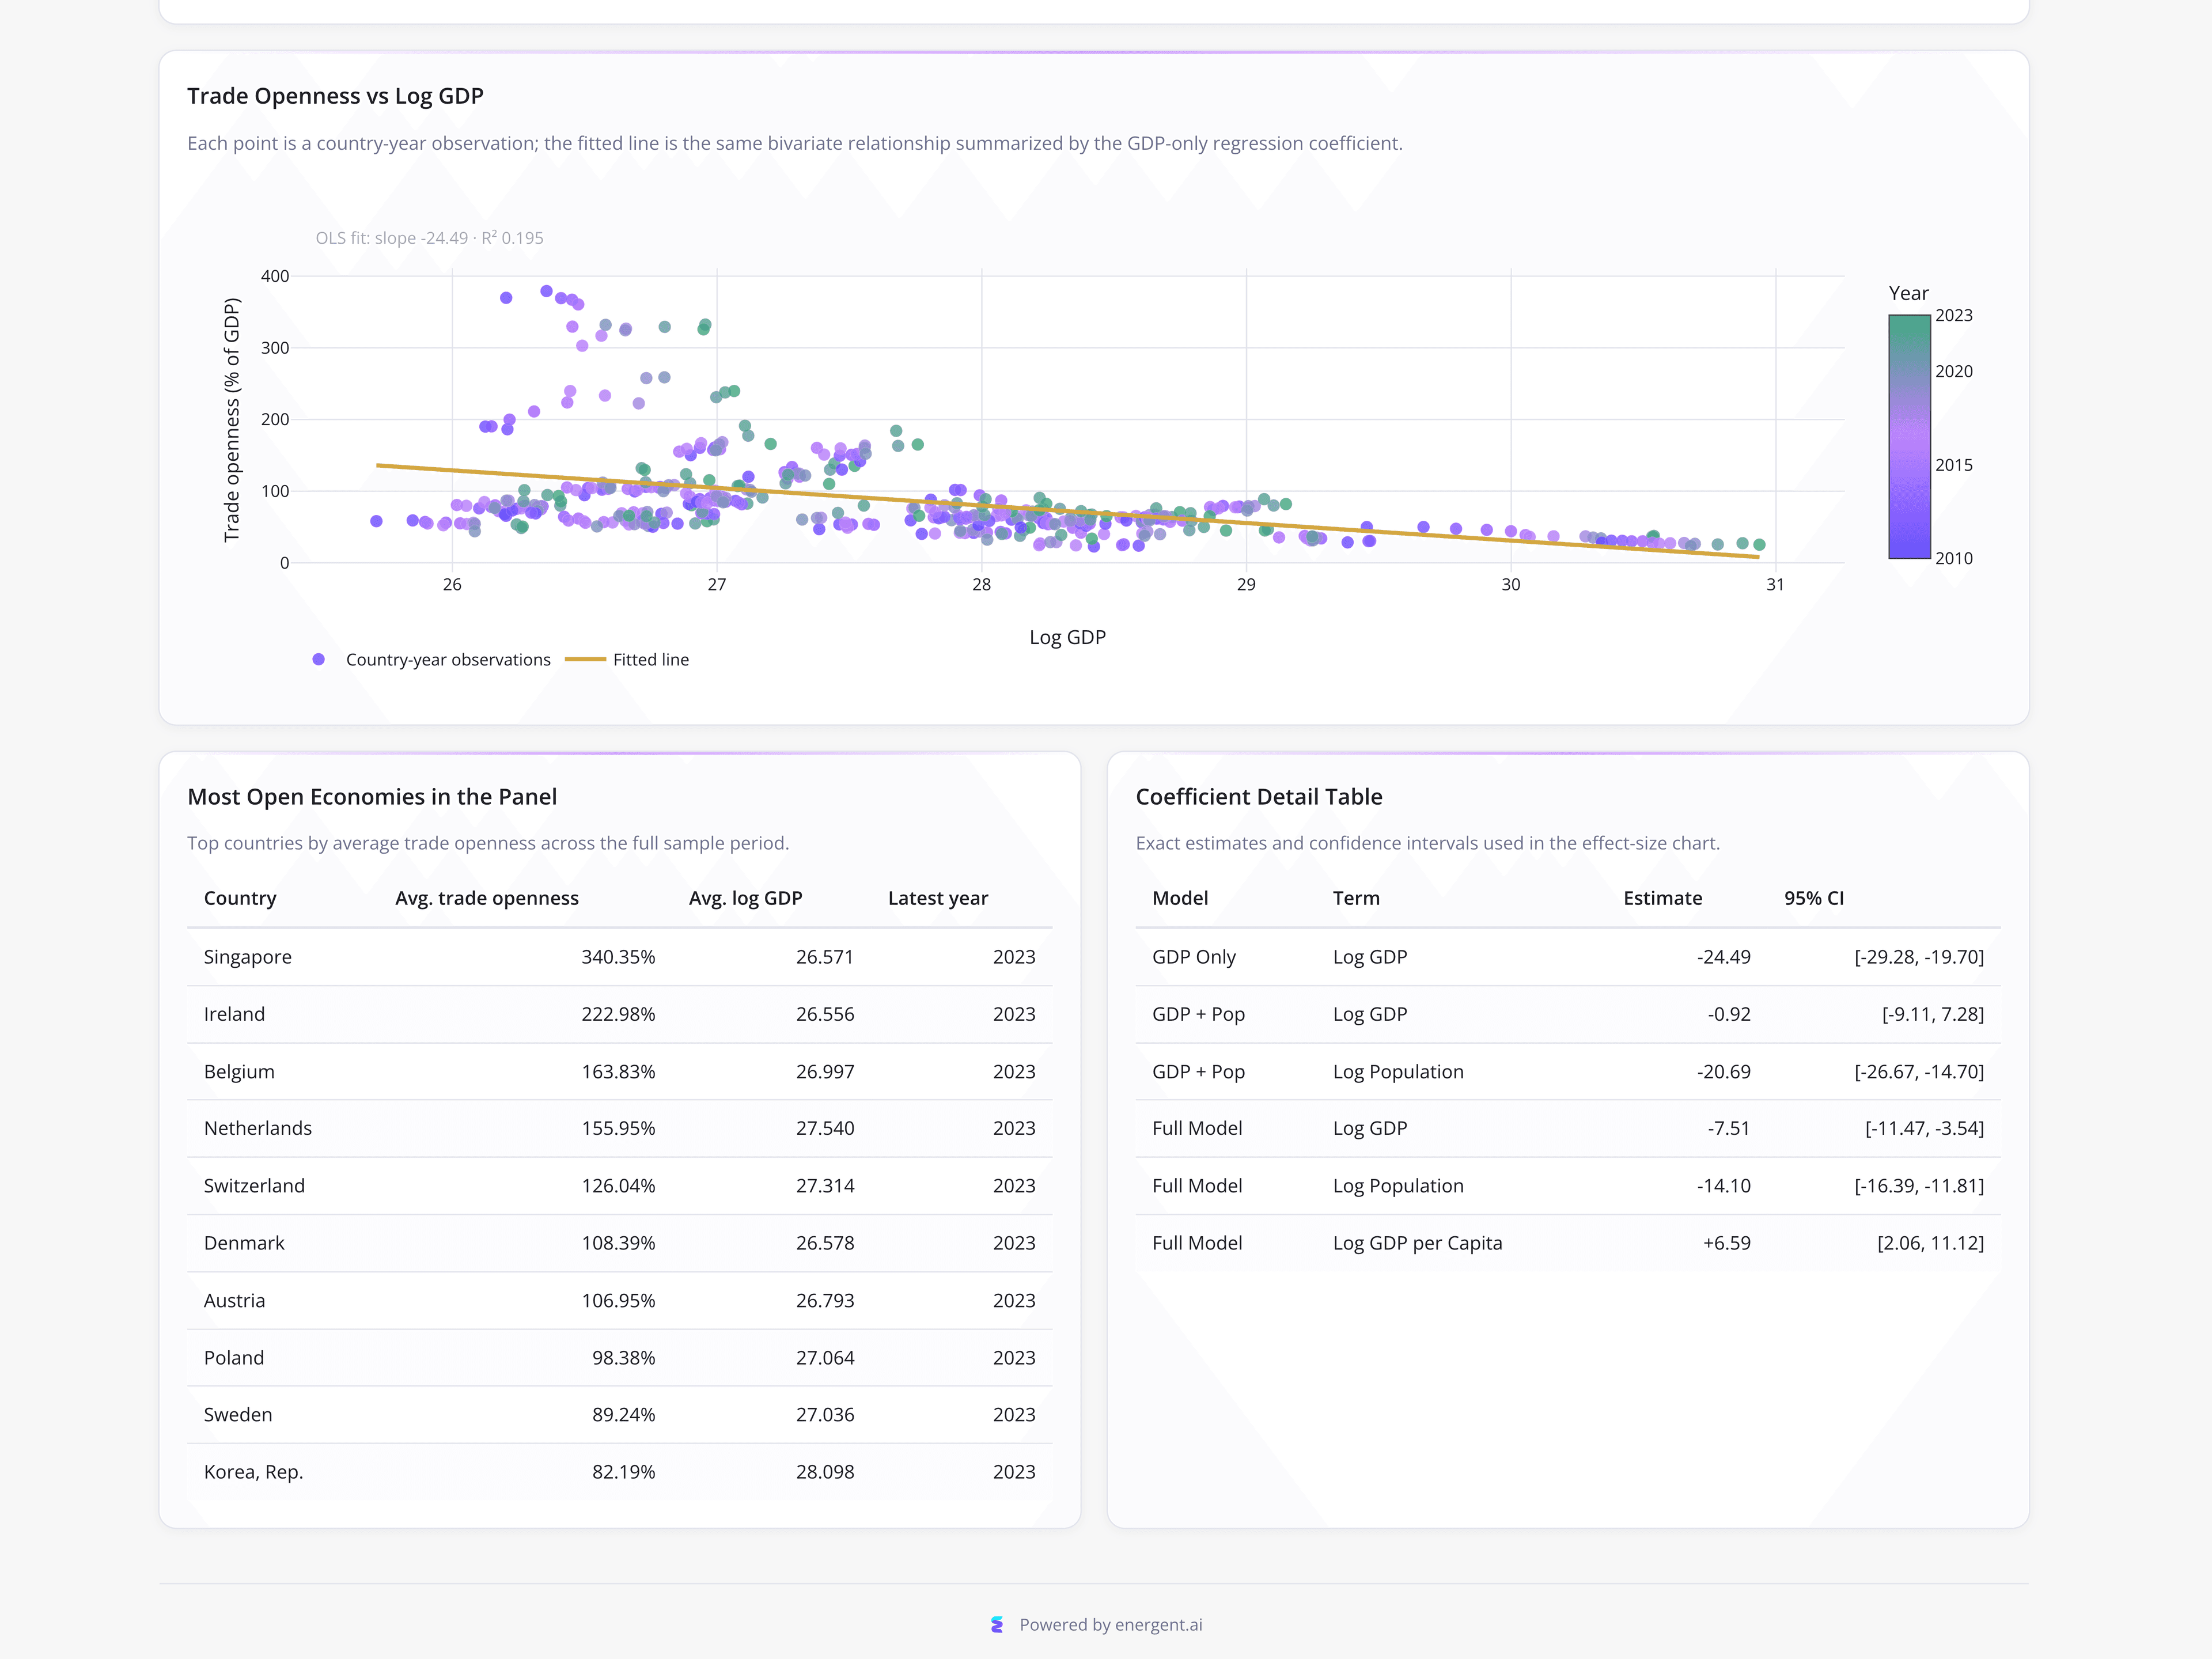
An International Trade Economist used a diagnostic dashboard to analyze gravity model regressions for trade openness across 30 major economies, where the baseline OLS scatter plot showed a relationship between Log GDP and Trade Openness with a slope of -24.49 and an R² of 0.195. Expanding the model to include population revealed a proxy-variable bias, collapsing the Log GDP estimate to -0.92 while Log Population captured the negative effect (-20.69), a shift often related to multicolinearity. The dashboard also facilitated outlier detection by ranking countries like Singapore (340.35%) and Ireland (222.98%) alongside their average log GDP.
What it shows:
How to identify proxy-variable bias and coefficient shifts in trade regressions.