1.Auto MPG Dataset Cleaning and Parsing
text panels and charts · 2026
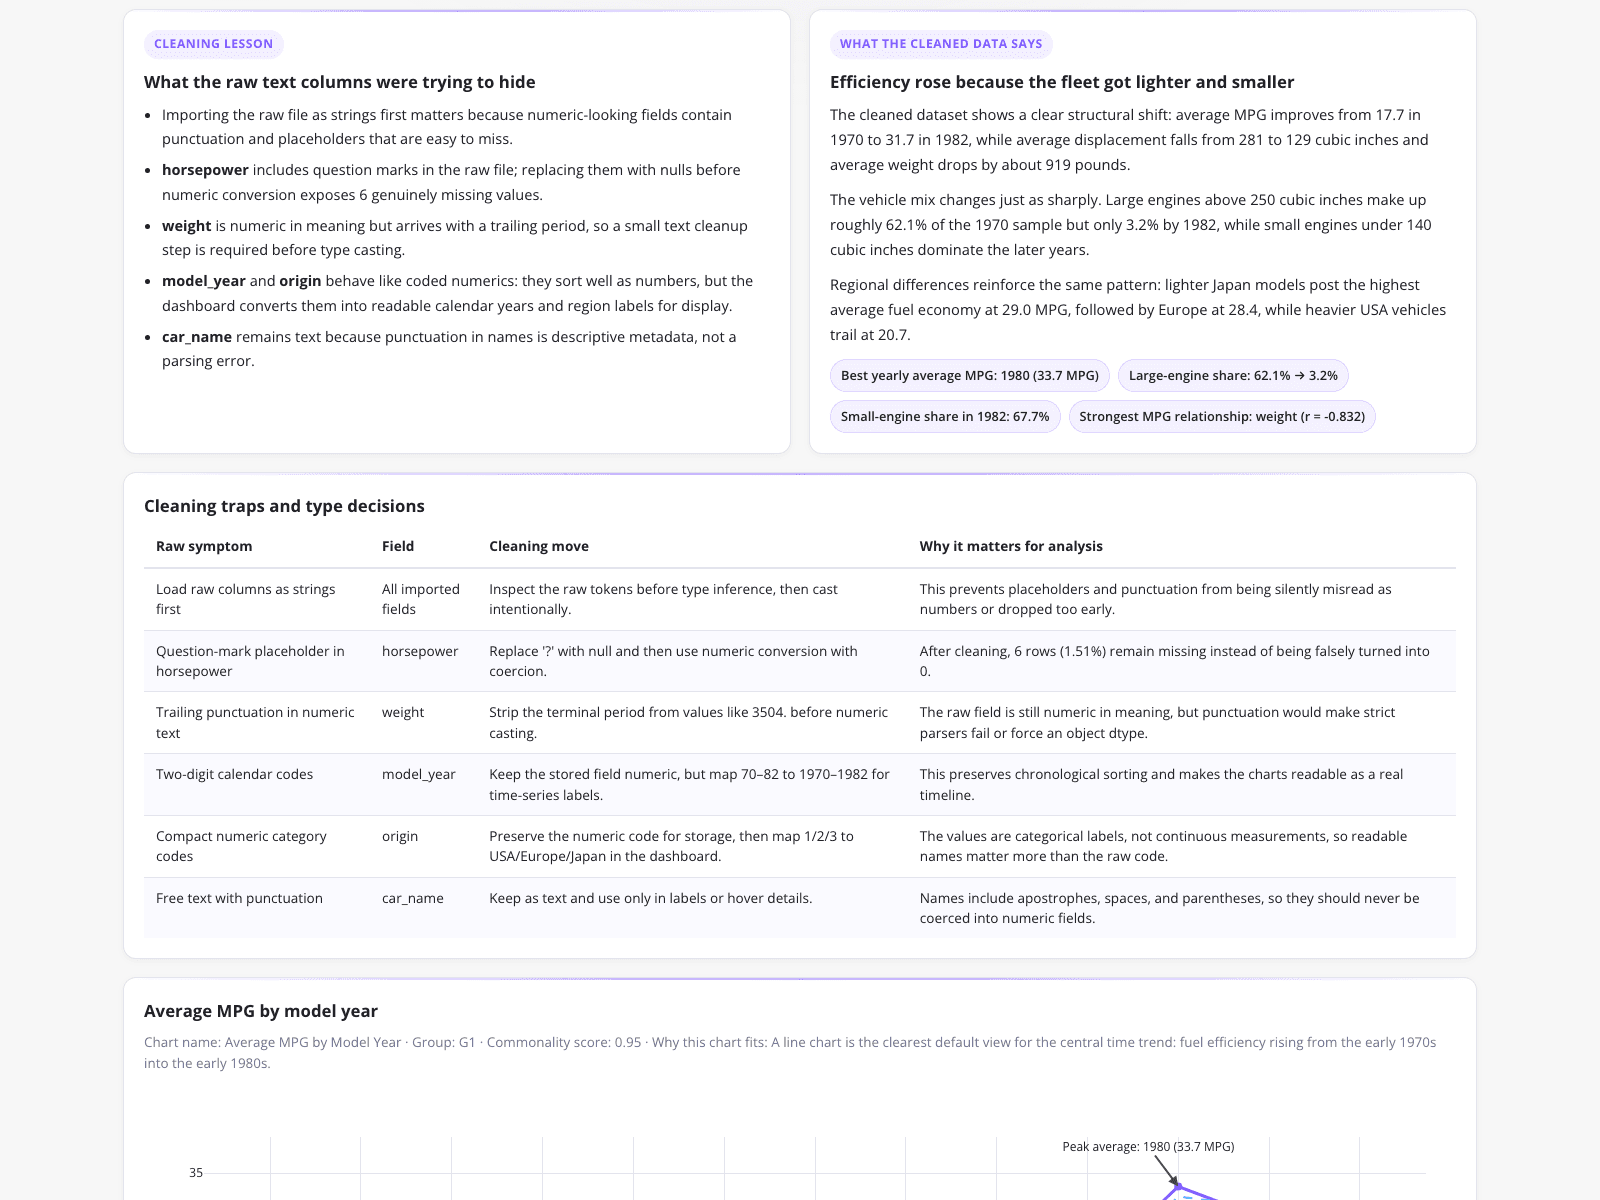
A data educator created a dashboard to document the cleaning process of the Auto MPG dataset, demonstrating how to chunk the text and parse structurally defective raw data. The interface highlights how replacing question marks in the horsepower column exposed 6 genuinely missing values, while stripping terminal periods from weight values prepared the data for analysis. The resulting text panels and charts show average MPG improved from 17.7 in 1970 to 31.7 in 1982, and large engines dropped from 62.1% to 3.2% of the sample.
What it shows:
How to parse and clean raw text fields to reveal historical trends.
#data-cleaning#auto-mpg-dataset#text-parsing