1.Developer Tool Adoption Analysis
Horizontal bar charts · 2026
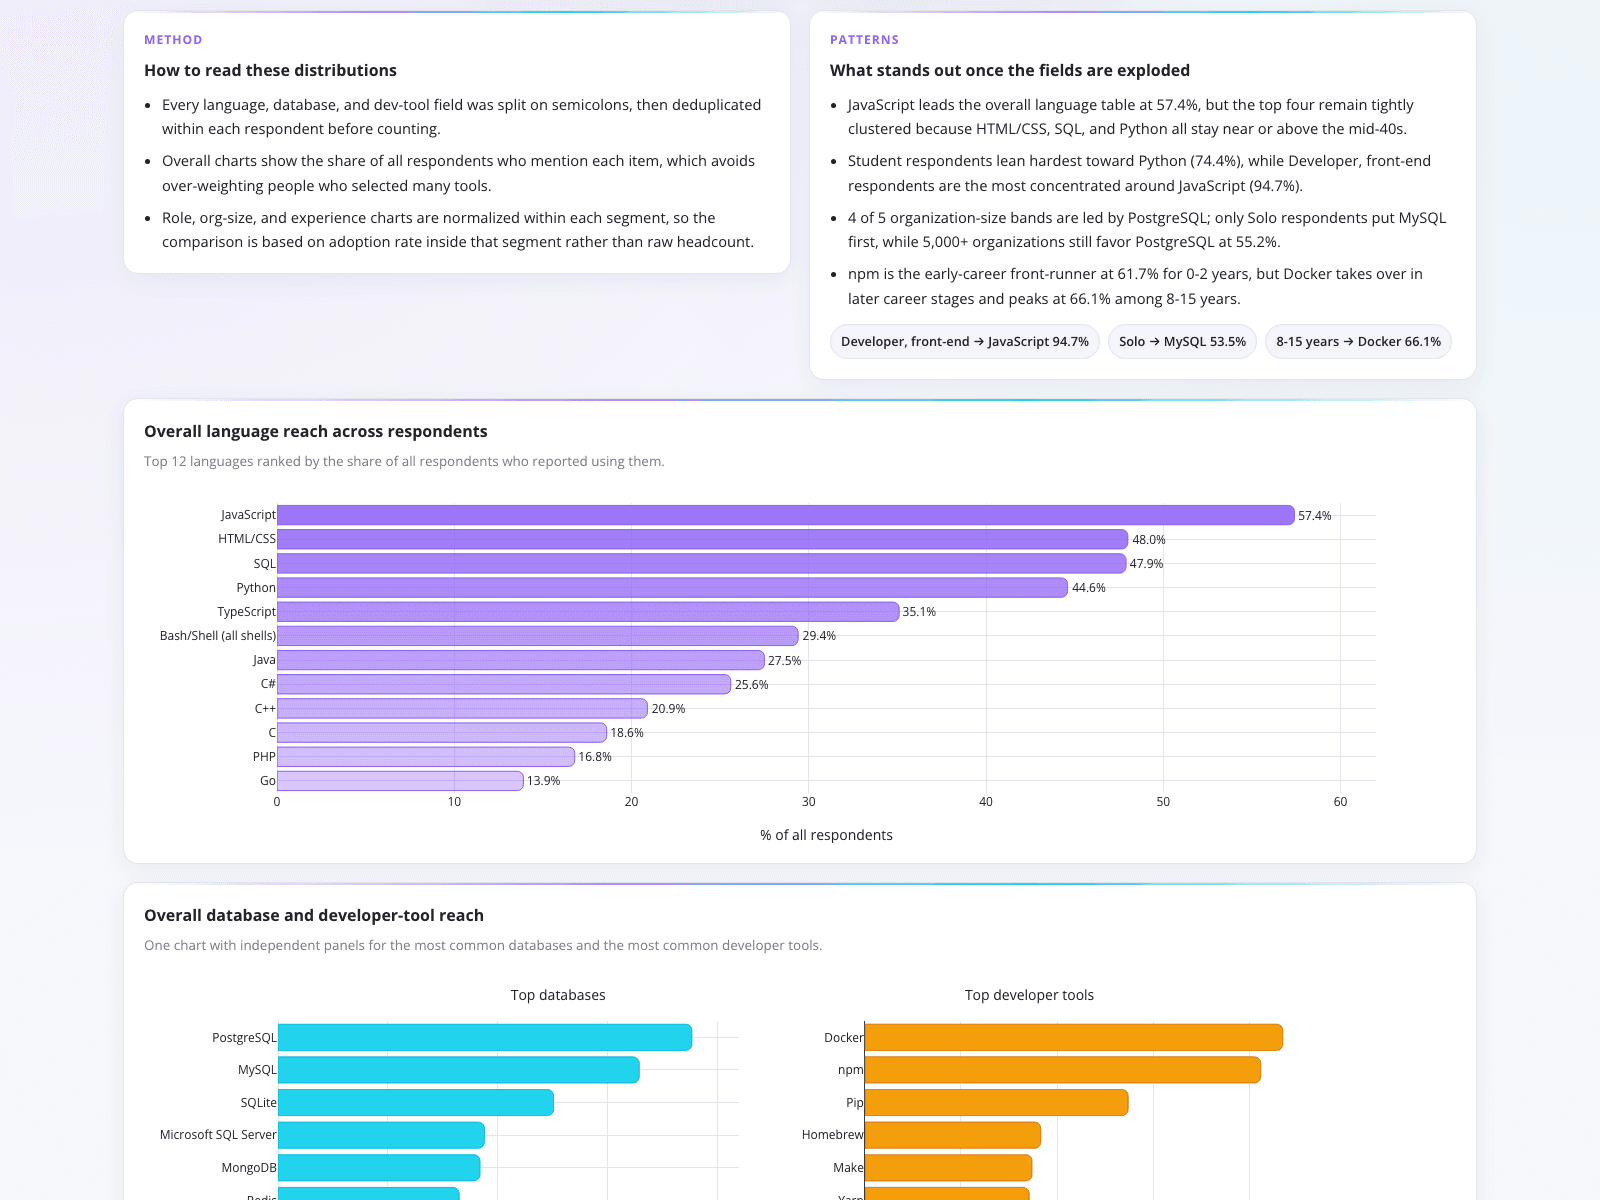
A developer relations analyst needed to transform raw, multi-select survey data into clear adoption metrics. Previously, parsing semicolon-separated tool selections required brittle manual scripts that risked inaccurate counts. This workflow automates the decomposition and deduplication of survey responses to accurately visualize tool adoption. The resulting dashboard highlights key patterns, noting that JavaScript leads overall language adoption at 57.4%, while Python dominates student respondents at 74.4%. It also reveals segment-specific insights, such as Docker reaching 66.1% adoption among developers with 8 to 15 years of experience. By splitting and normalizing the raw delimited data, stakeholders gain an immediate, accurate view of actual tool usage across the ecosystem.
What it shows:
Automating the decomposition of delimited fields prevents manual errors and surfaces accurate segment-specific insights.